Part II: Australia's ASX-listed advertisers mapped, does ad spend correlate to share price? Woolworths, Coles, Telstra, Harvey Norman charted

An exercise in correlation: Mi3 mapped advertising spend to share price data between 2018 and 2020 for some of Australia's biggest brands.

What relationship does brand spend have to a company's share price? Kraft Heinz took a $15 billion write down in early 2019 and watched its share price collapse after neglecting it – an ironic reward for shareholders and disciples of zero-based budgeting. Mi3 mapped ad spend for some of Australia's biggest ASX-listed advertisers from 2018 to 2020, including the collapse caused by Covid-19. Here's what we found in part two.
Spend and return
Yesterday, Mi3 published a series of graphs charting some of Australia's biggest ASX-listed advertisers, and how their ad spend varied between 2018 and 2020. Commonwealth Bank of Australia, NAB, Westpac, ANZ, IAG and Suncorp were featured in the first part. Today we map Woolworths, Coles, Harvey Norman, Telstra and other major spenders.
This is a crude experiment. In early 2019, Kraft Heinz wrote down the value of its business by $15 billion, after years of “zero-based budgeting” following a merger with private equity giant 3G Capital. It neglected its brand spend, its share price tumbled and 3G's billionaire owner Jorge Paulo Lemann eventually claimed that cost-cutting would play second fiddle to consumer focus.
But what is the relationship between ad spend and share price – and is there any correlation?
University of North Carolina Professor of Marketing Jan-Benedict Steenkamp suggests The Kraft Heinz experience provides “incontrovertible” evidence.
“[3G Capital] may be generating a lot of wealth for their owners, I don’t know. But they sure as heck are not creating it for shareholders,” he stated.
Mi3 wanted to test that hypothesis. So we mapped Nielsen's quarterly brand advertising spend data to share prices of some of Australia's biggest ASX-listed advertisers with some graphics help from the team at Hardhat:
Important caveats:
- Share price is a result of multiple factors, of which marketing investment is just one. Nobody really understands its make-up, even Warren Buffett, as the Kraft Heinz debacle illustrates.
- This is an exercise in pure correlation, using ad spend as a proxy for marketing investment.
- It follows Nielsen's estimated quarterly above the line (ATL) ad spend data, which does not include online, social or search, for three years, from 2018 through the Covid anomaly of 2020.
As mentioned, yesterday's part one maps the big four banks, IAG and Suncorp, plus some potential outliers in Bega and Webjet. Today, we map Woolworths, Coles, a big spending Harvey Norman, and others - and we may add new data layers like brand health metrics and brand valuations for additional leaps into correlation.
We would be interested in reader views via the comments section or direct via editorial@mi-3.com.
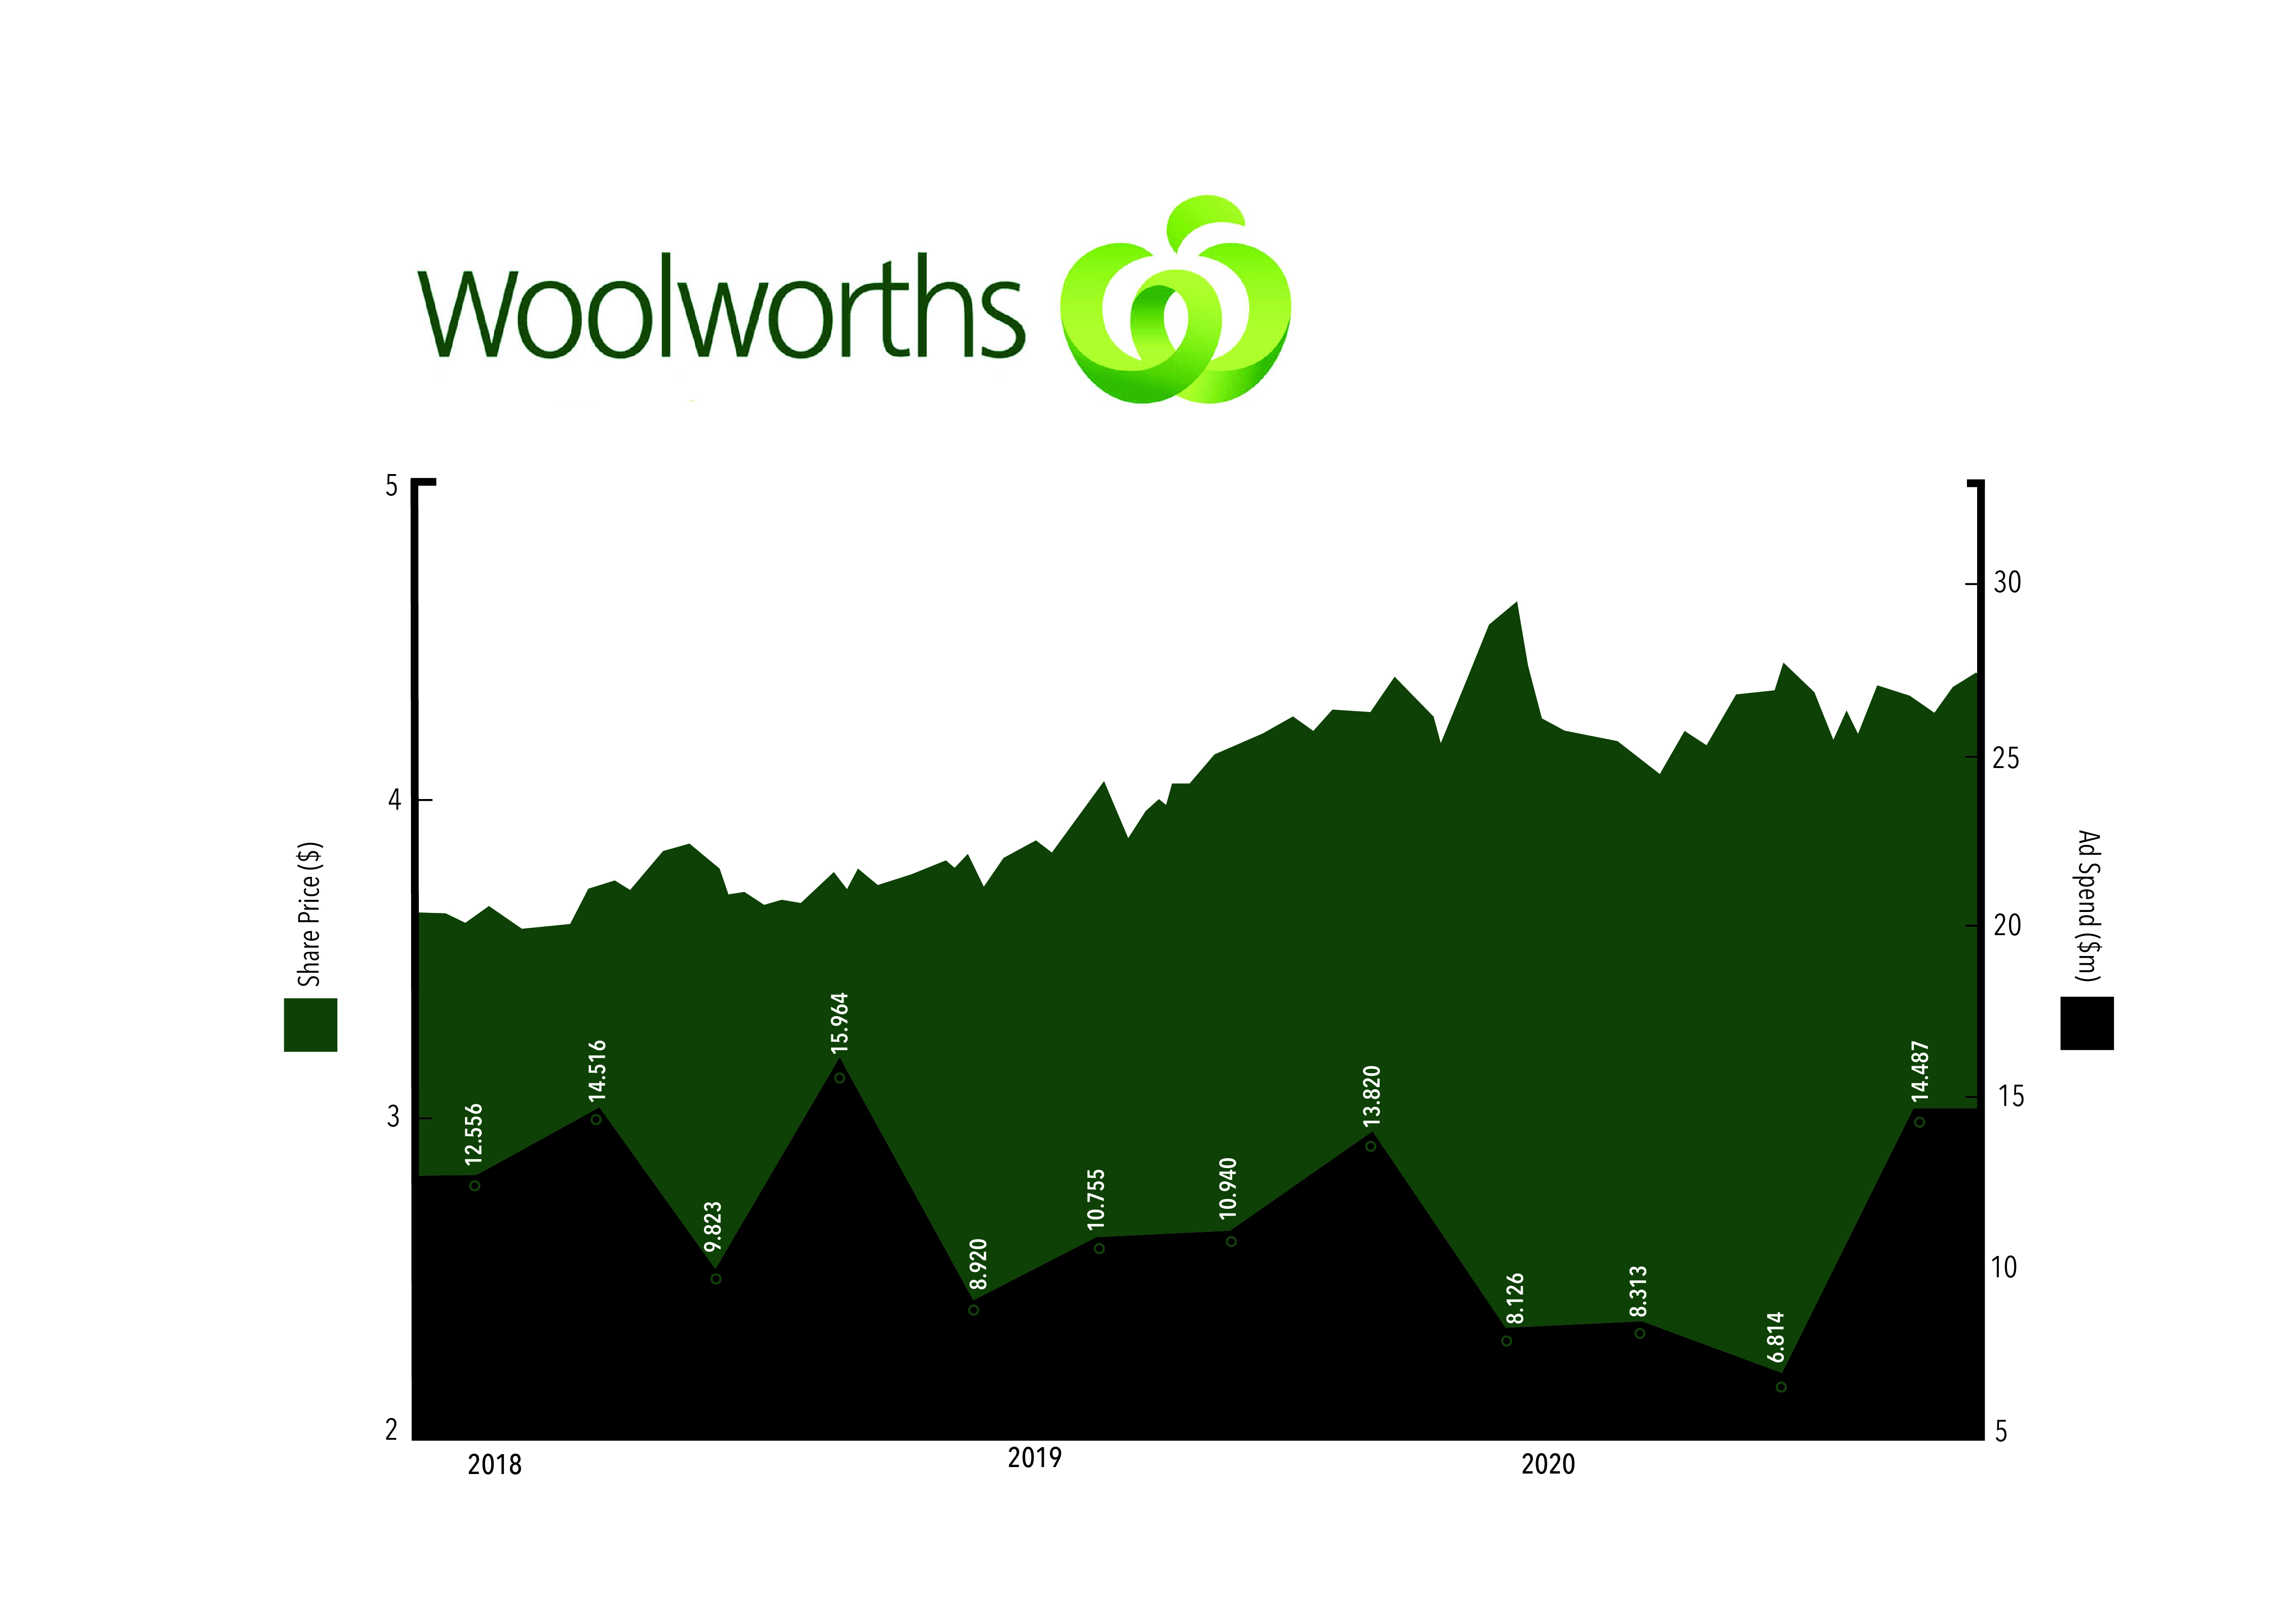
Woolworths Group is one of the country's larger spenders, with an average of $11.25m per quarter between 2018 and 2020.
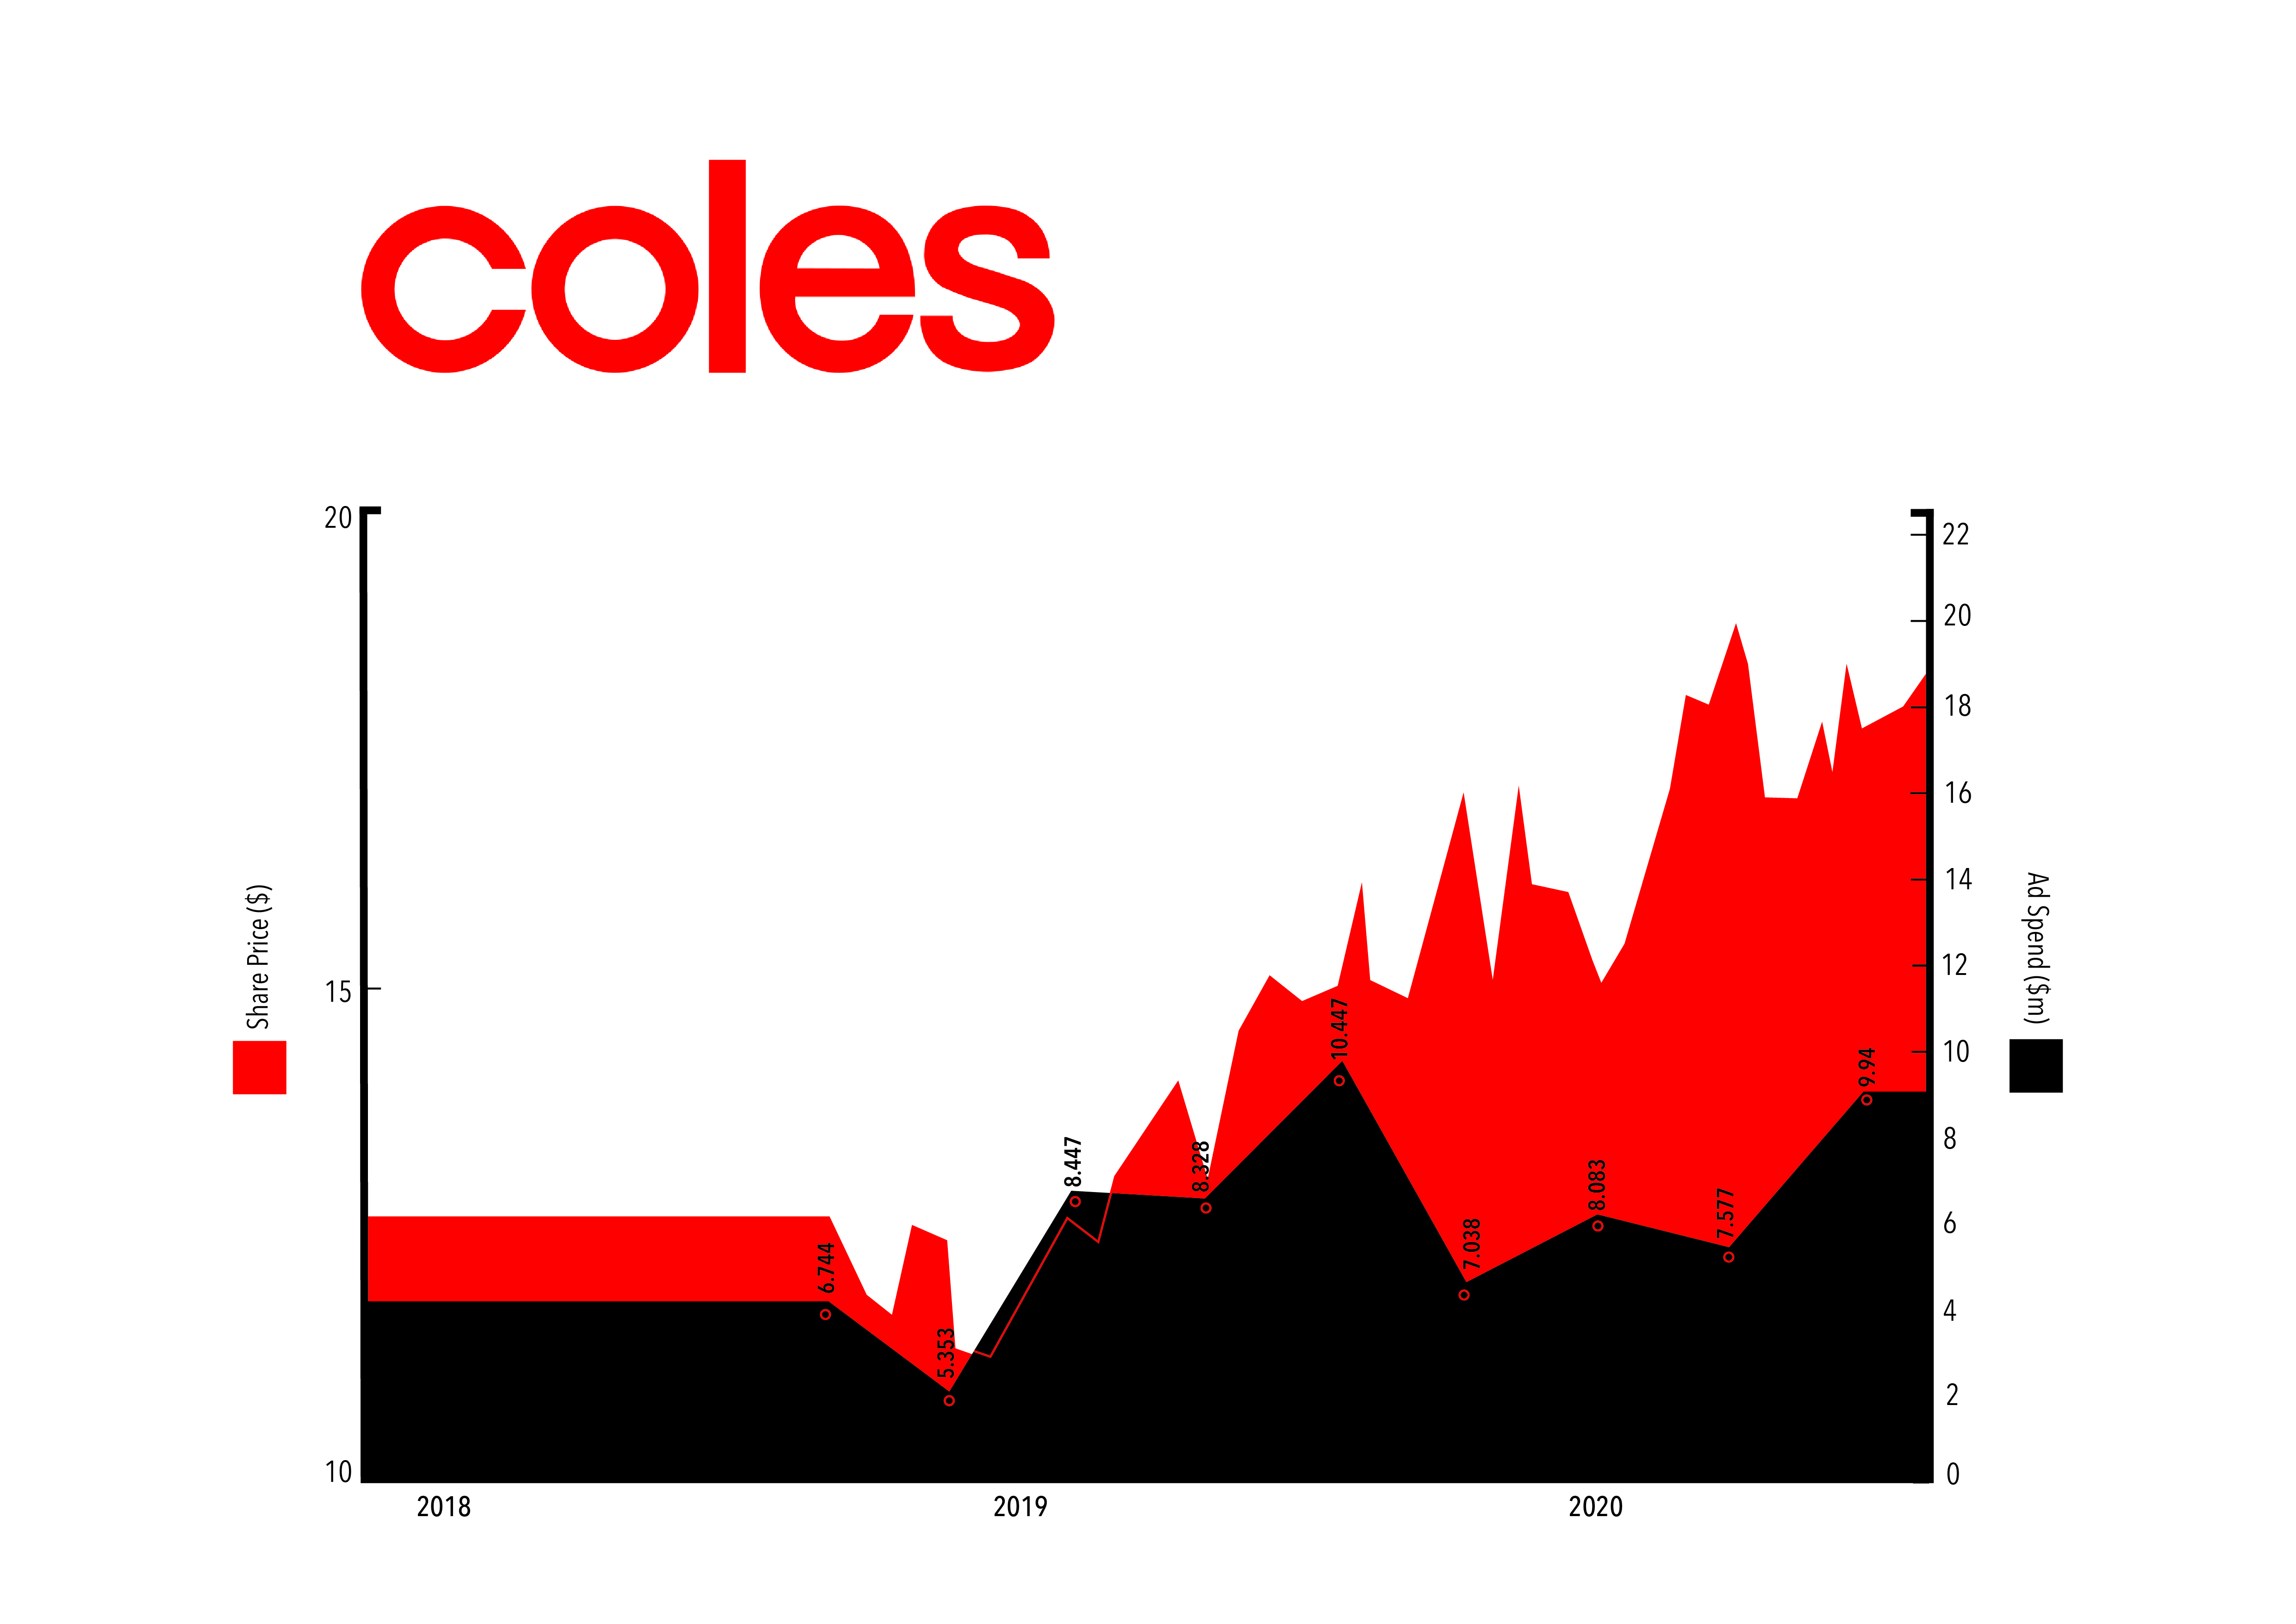
Coles Group was listed in November 2018, when it was carved off from Wesfarmers. ince then, it has averaged $7.99m per quarter in ad spend.
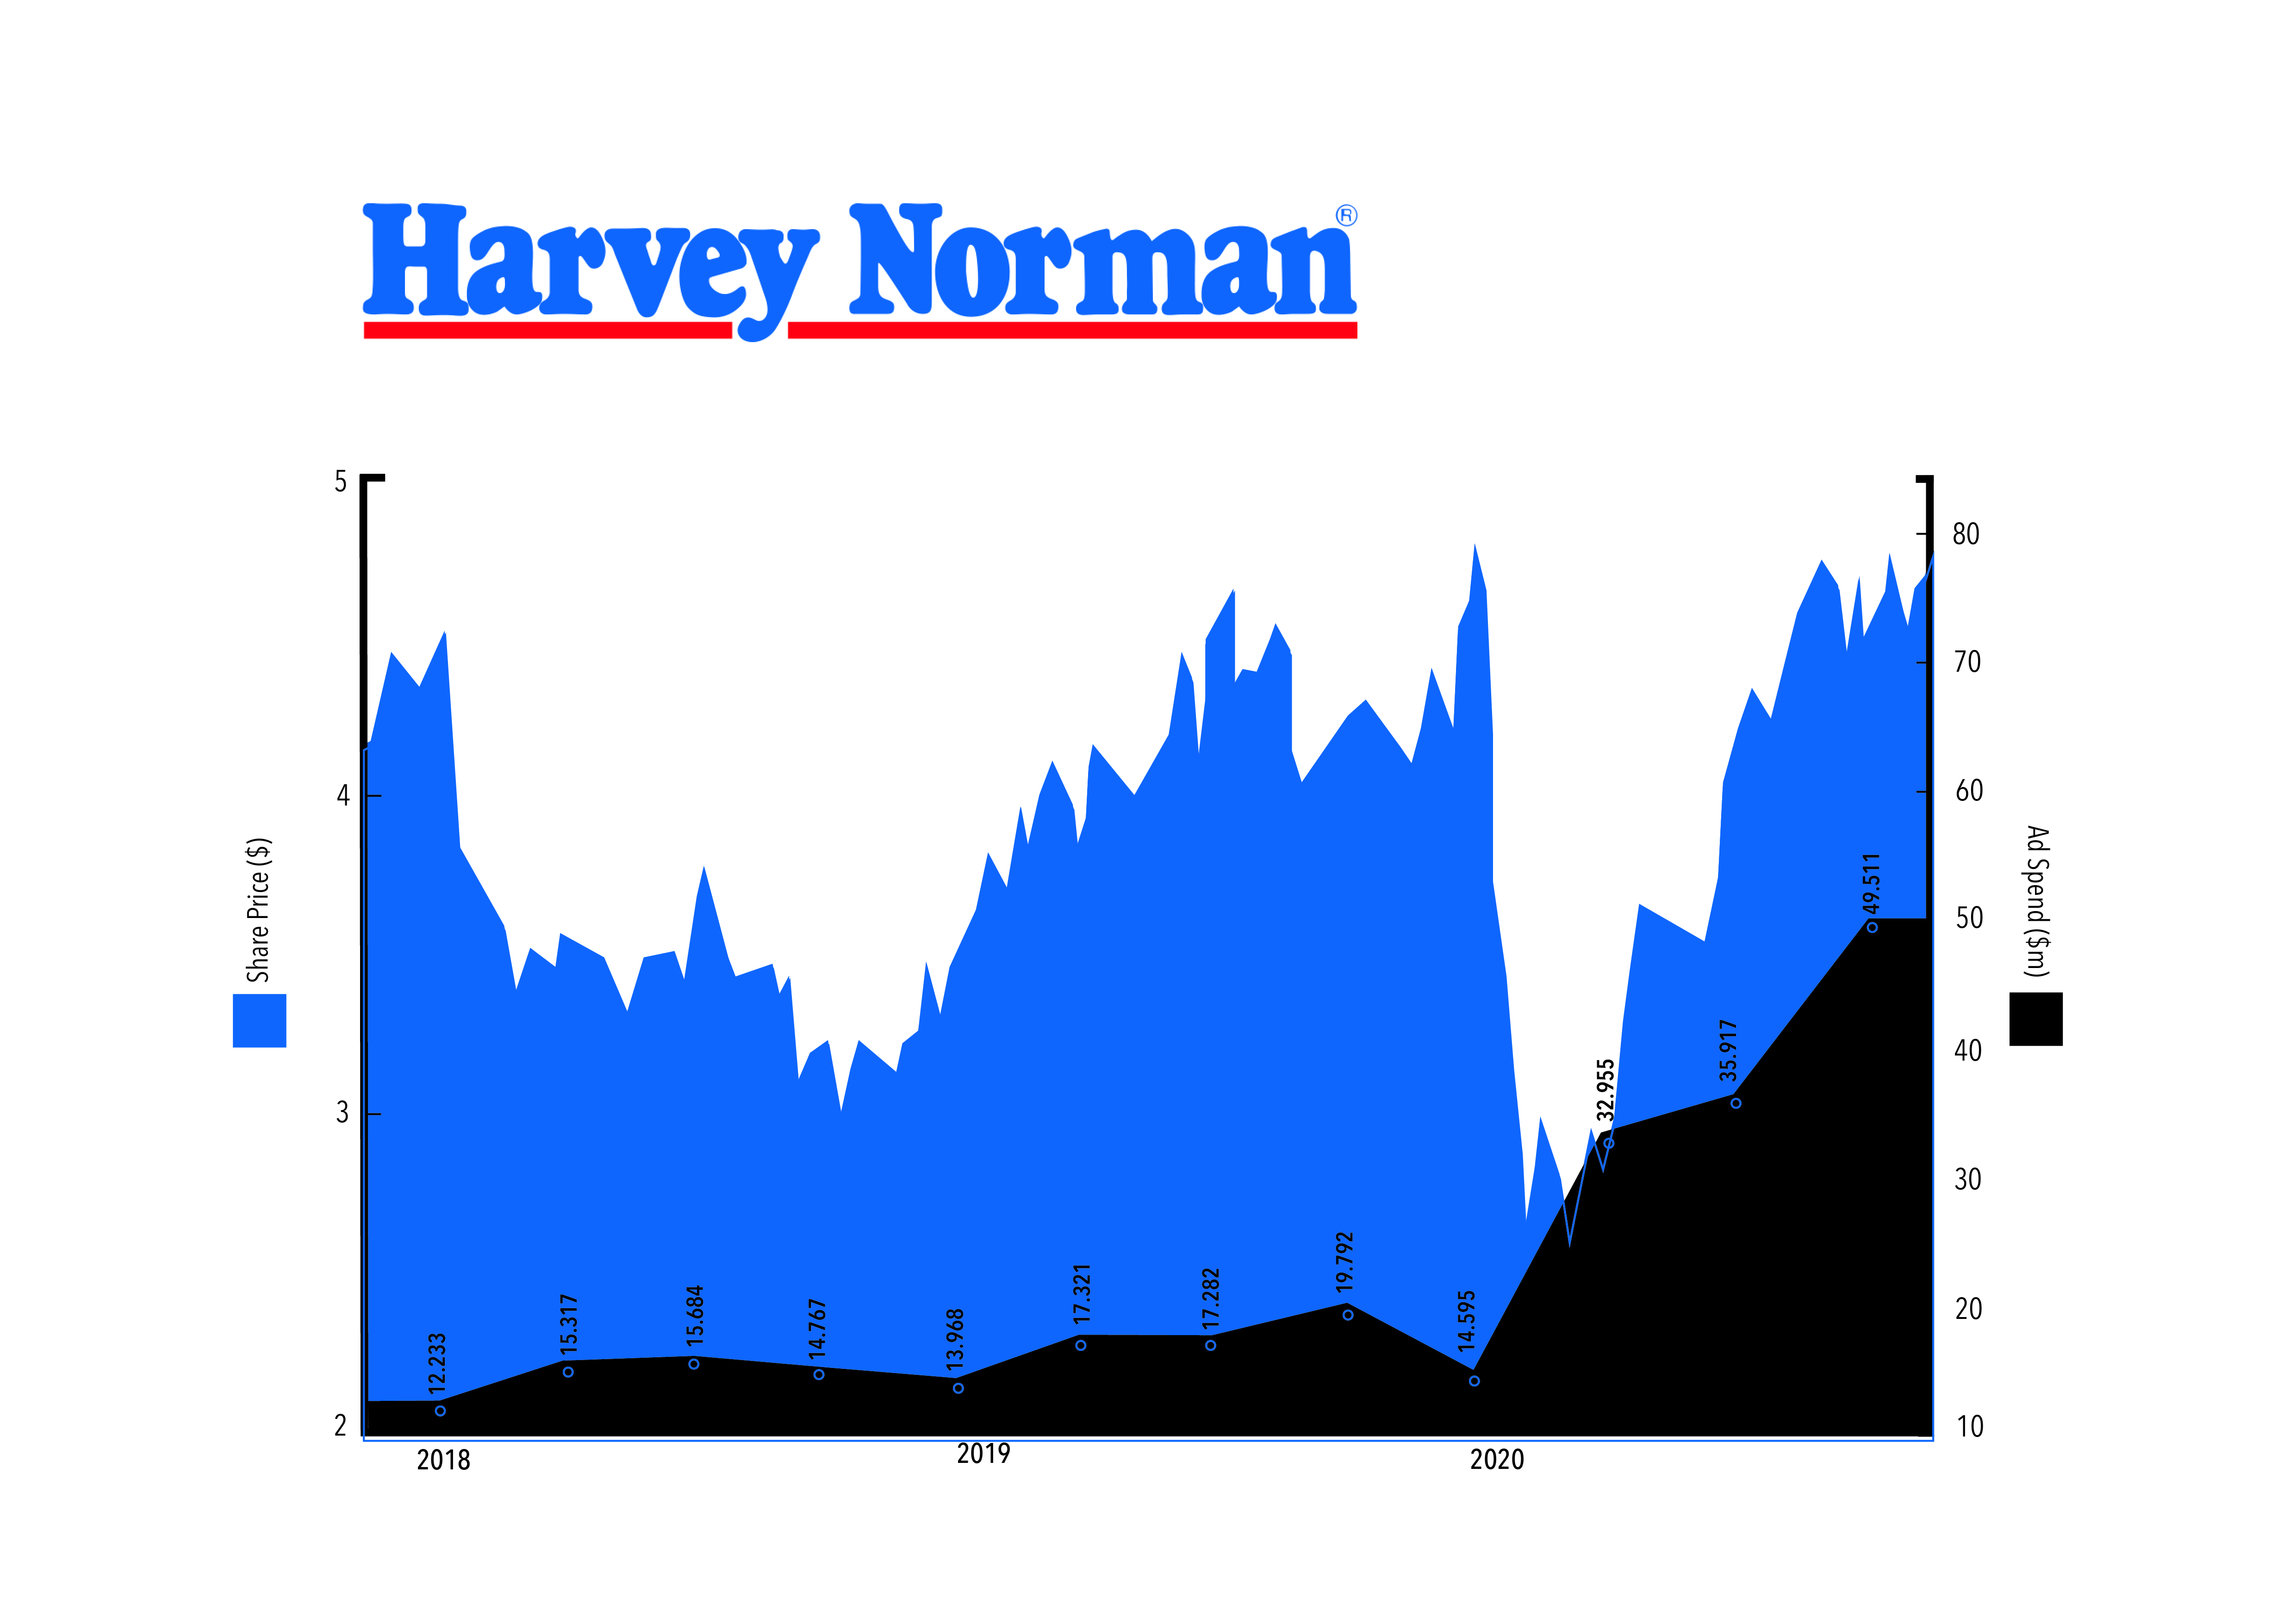
Harvey Norman more than tripled its quarterly ad spend during the pandemic, to $49.5m. Its average quarterly spend was $21.61m between 2018 and 2020.
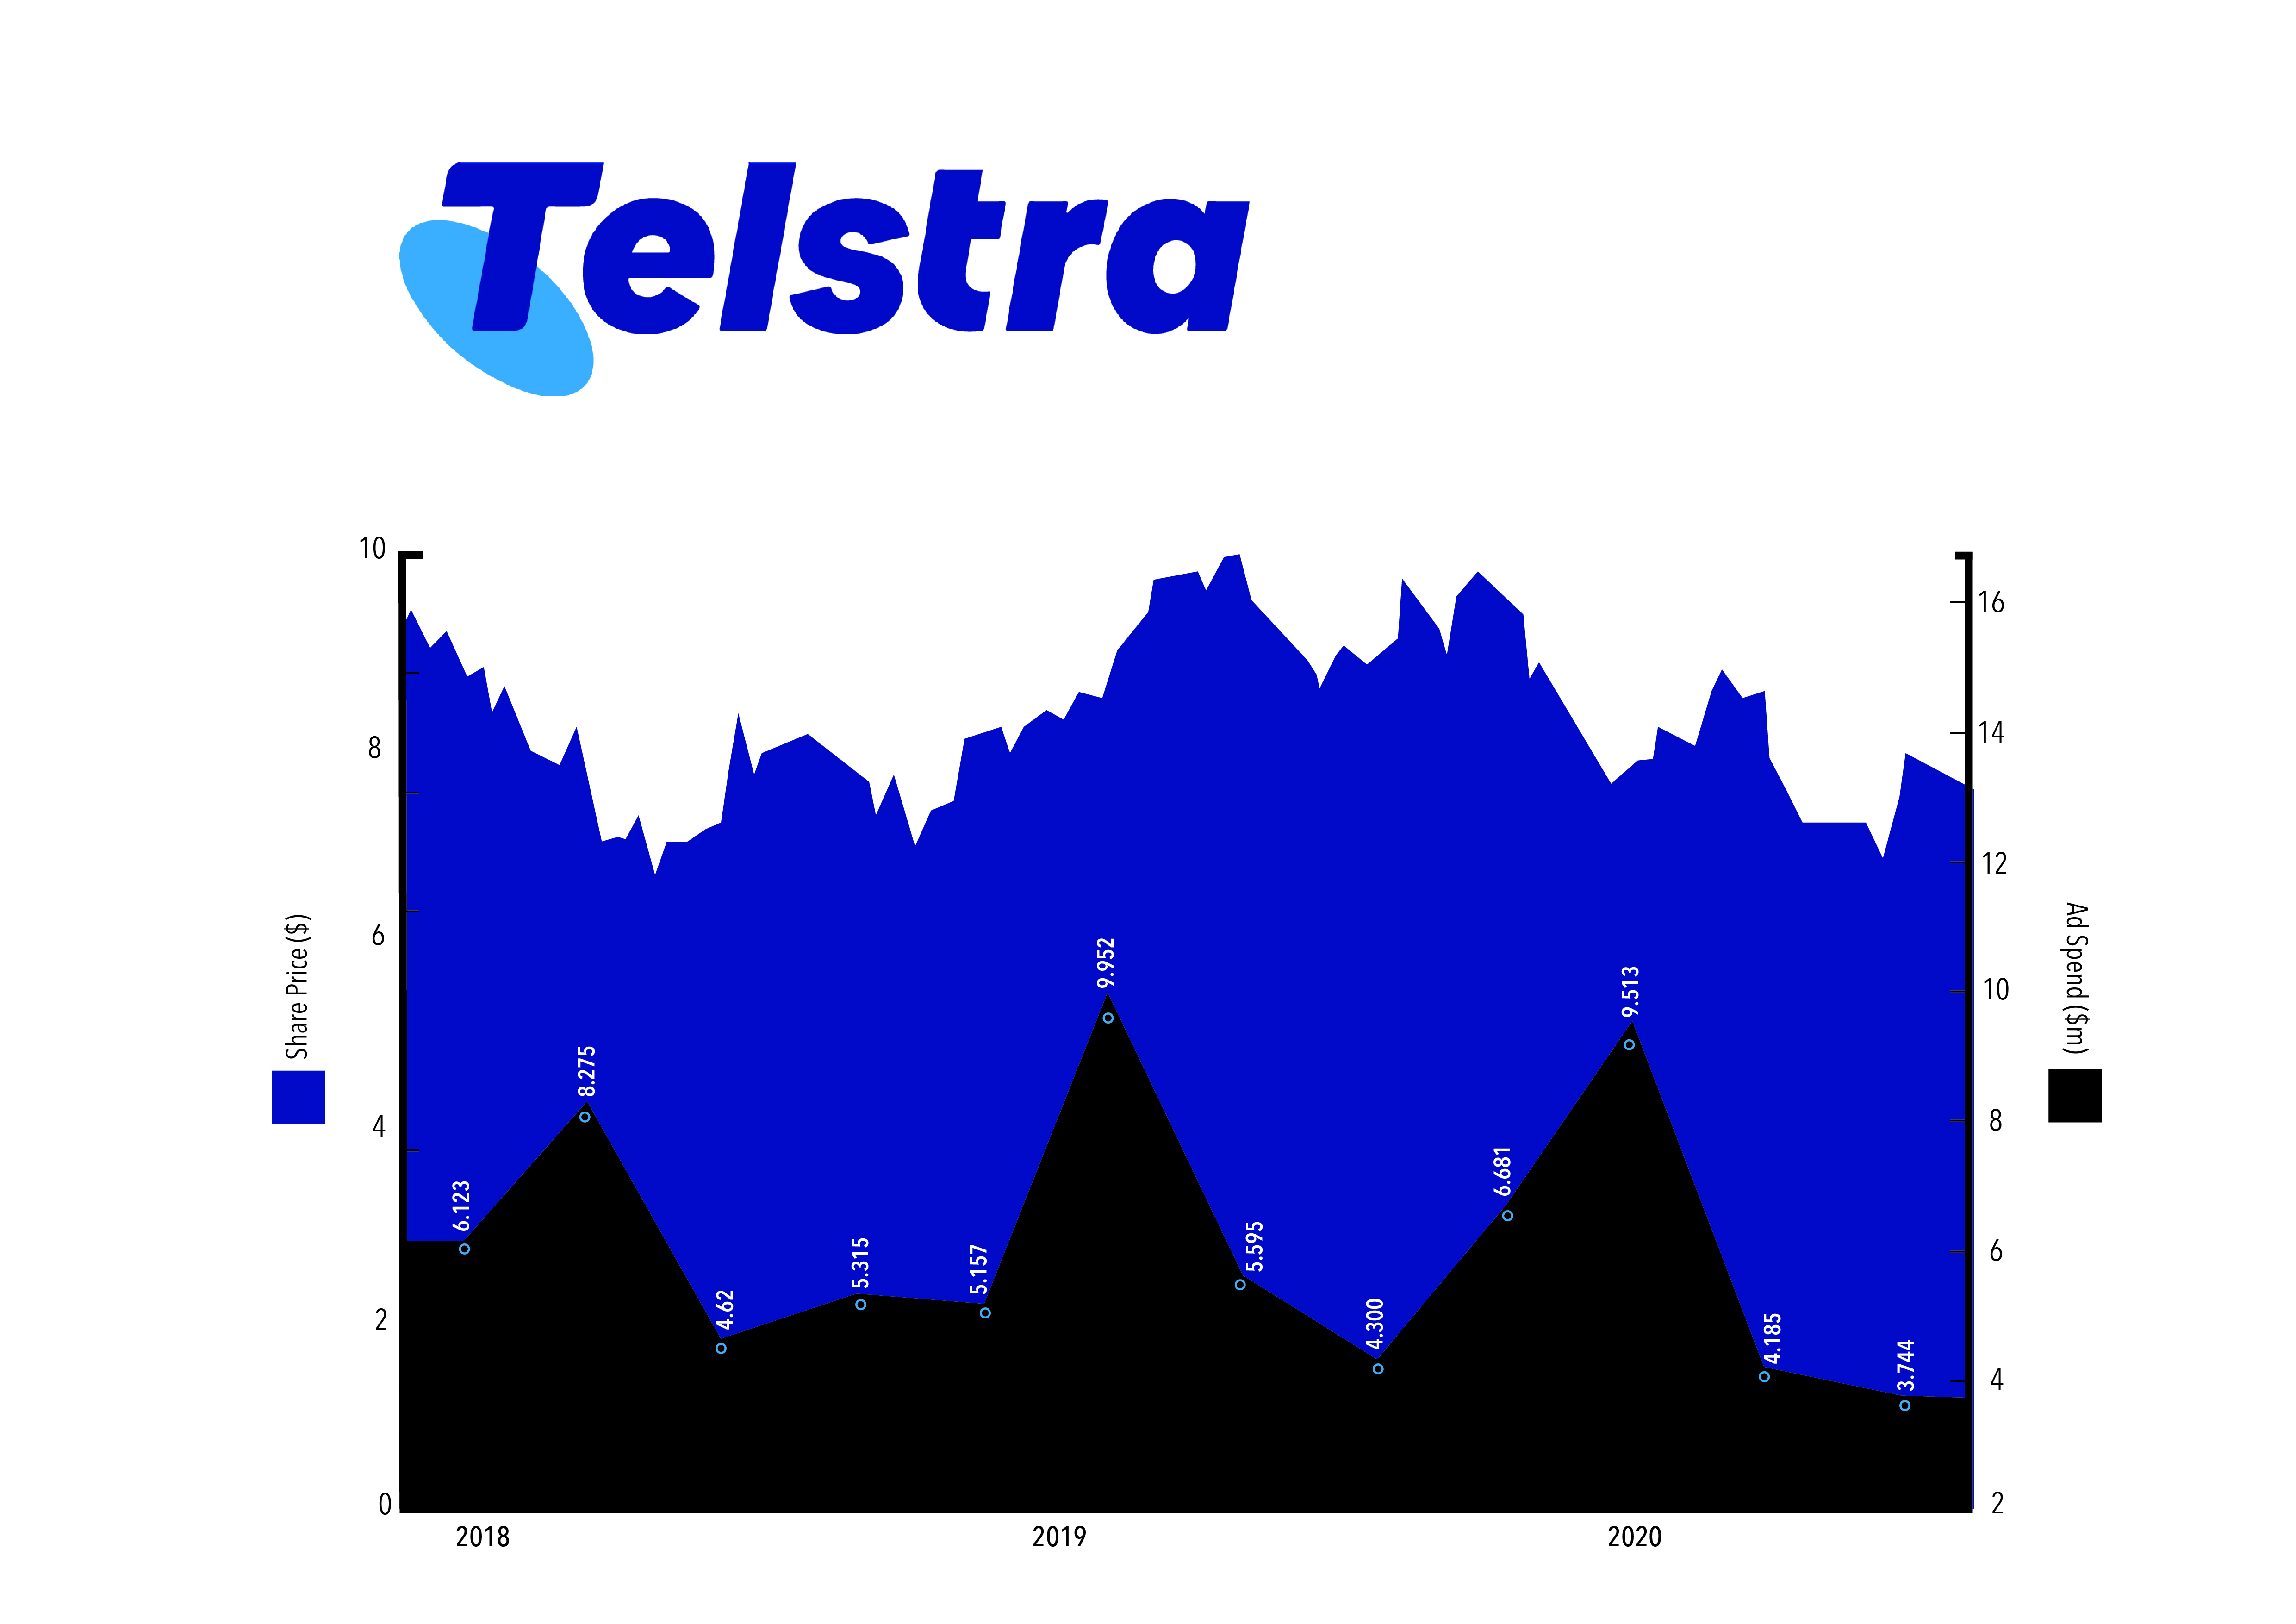
Telstra's ad spend was $6.12m per quarter between 2018 and 2020, according to the Nielsen data.
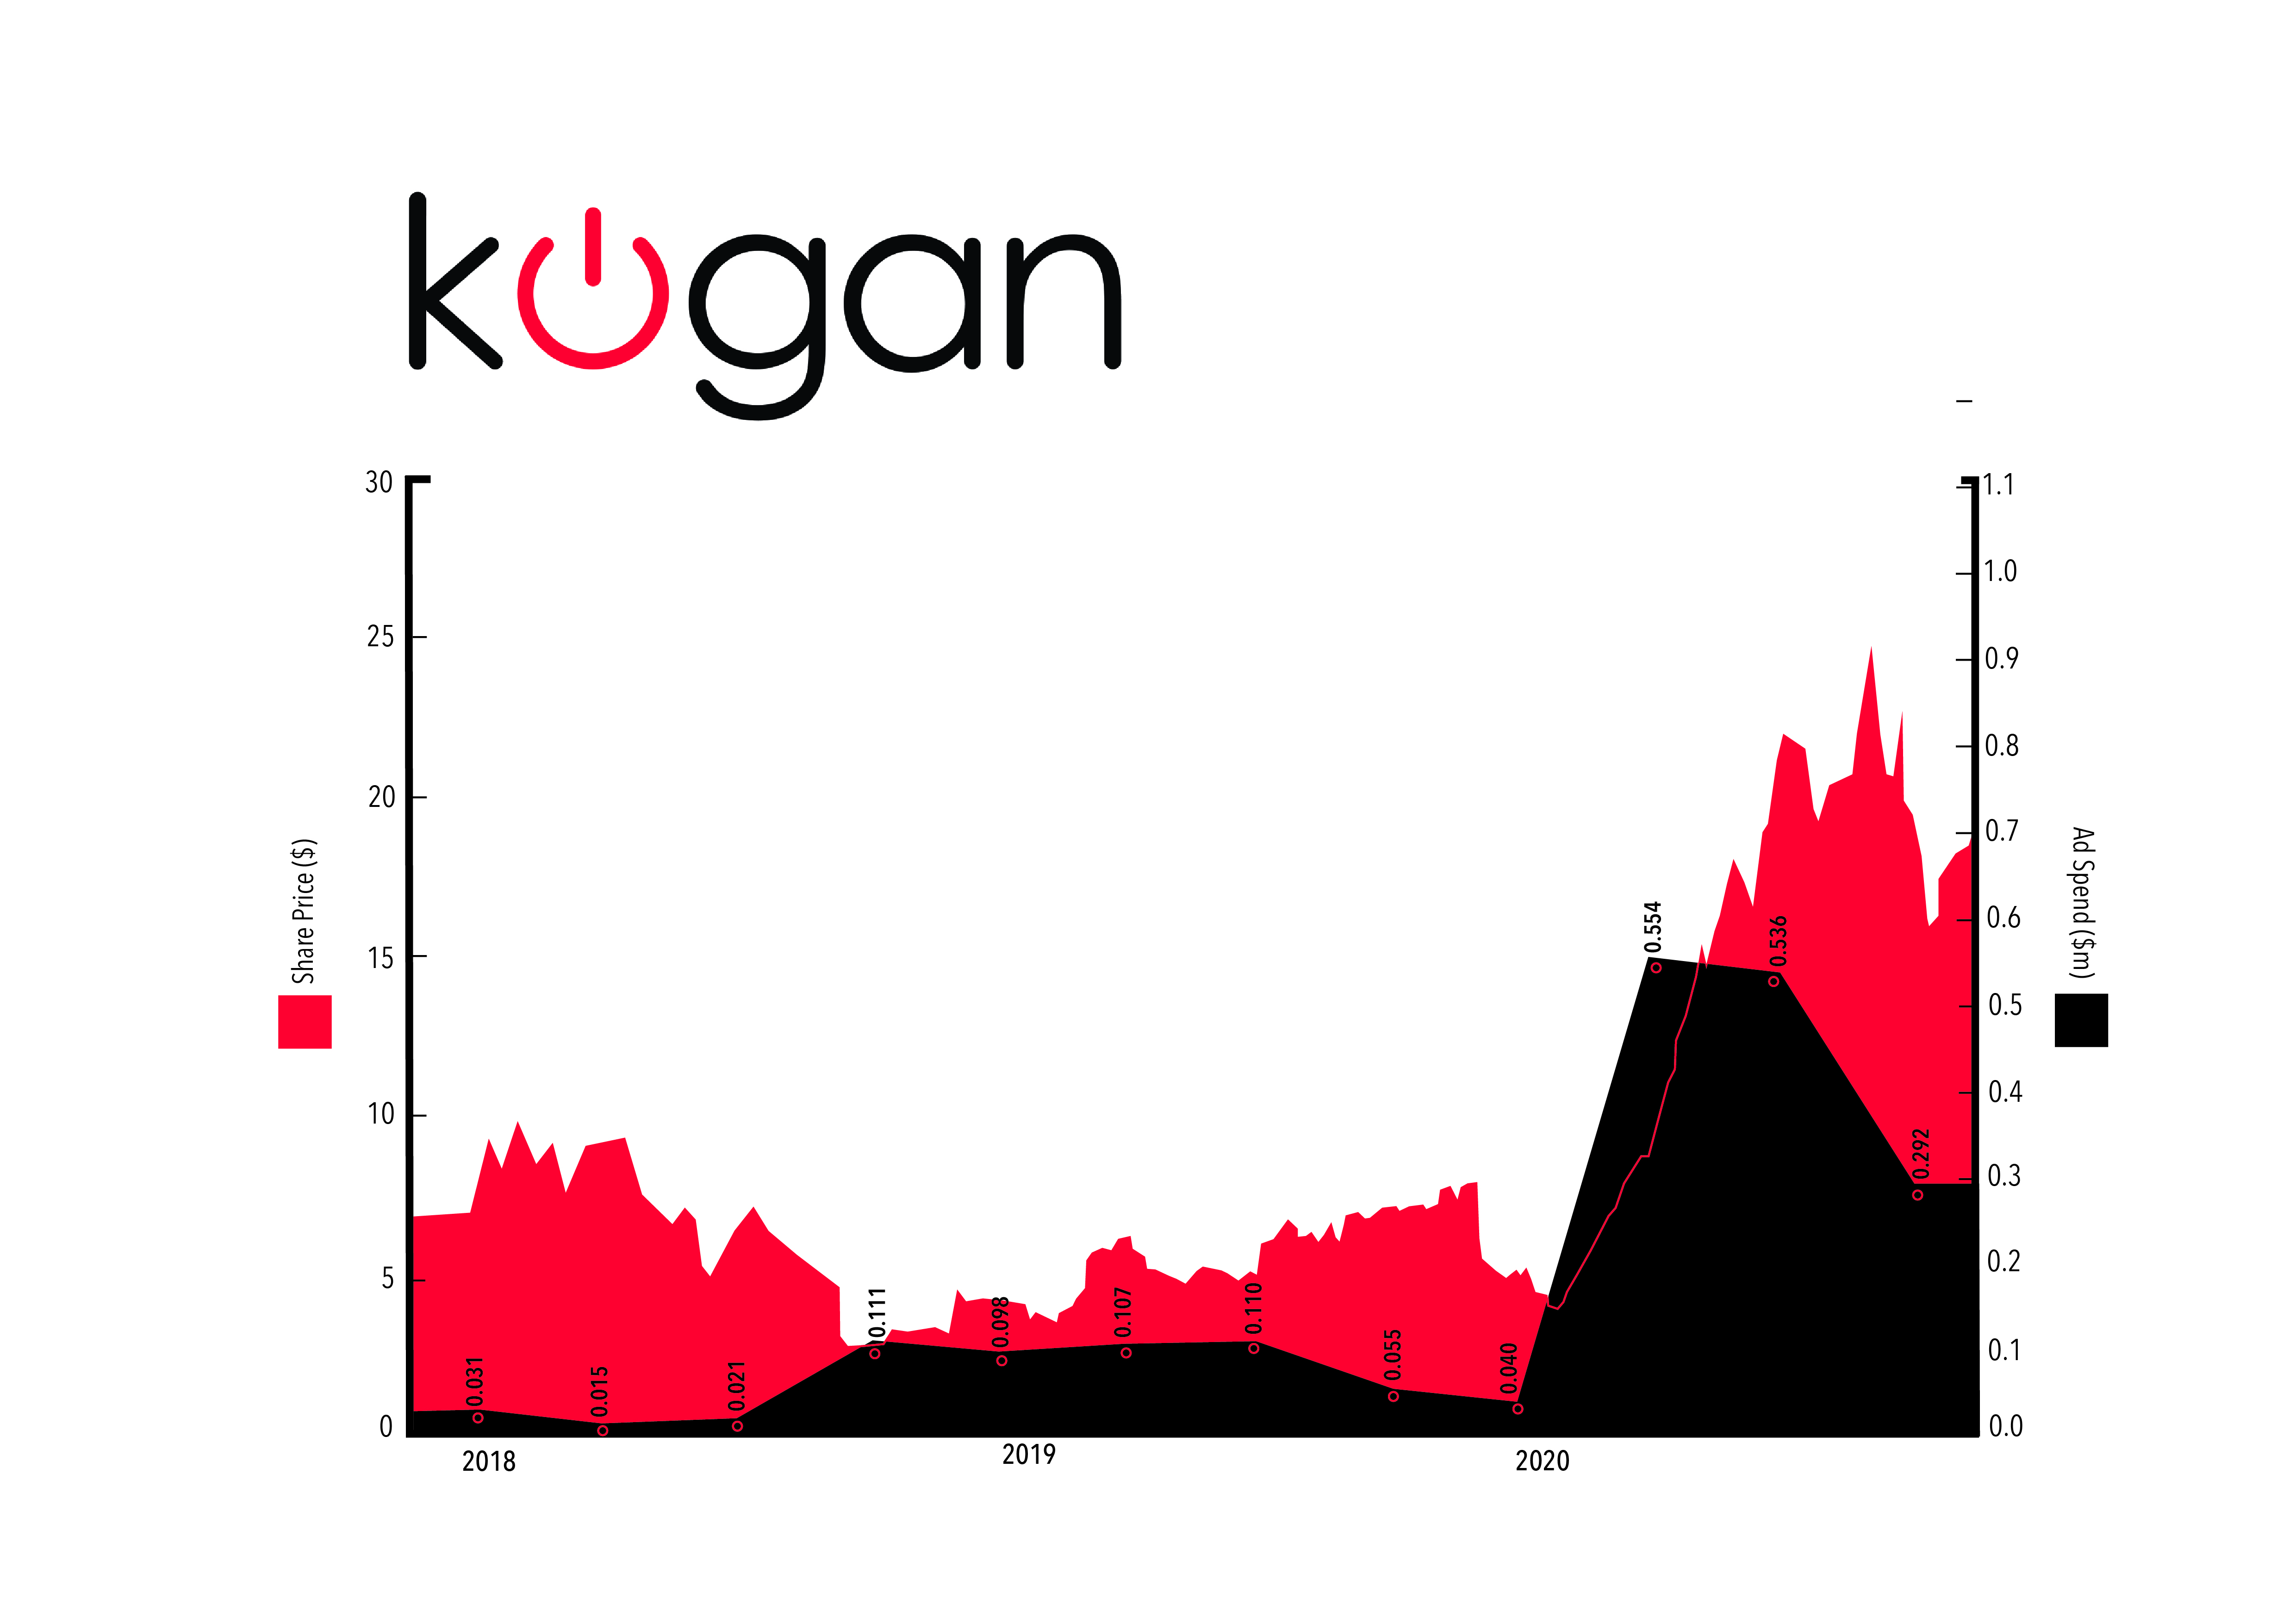
Kogan averaged $164,000 per quarter from 2018 and 2020, but, notably, bought television space for the first time in April 2020 - a month into the pandemic and when its share price soared.
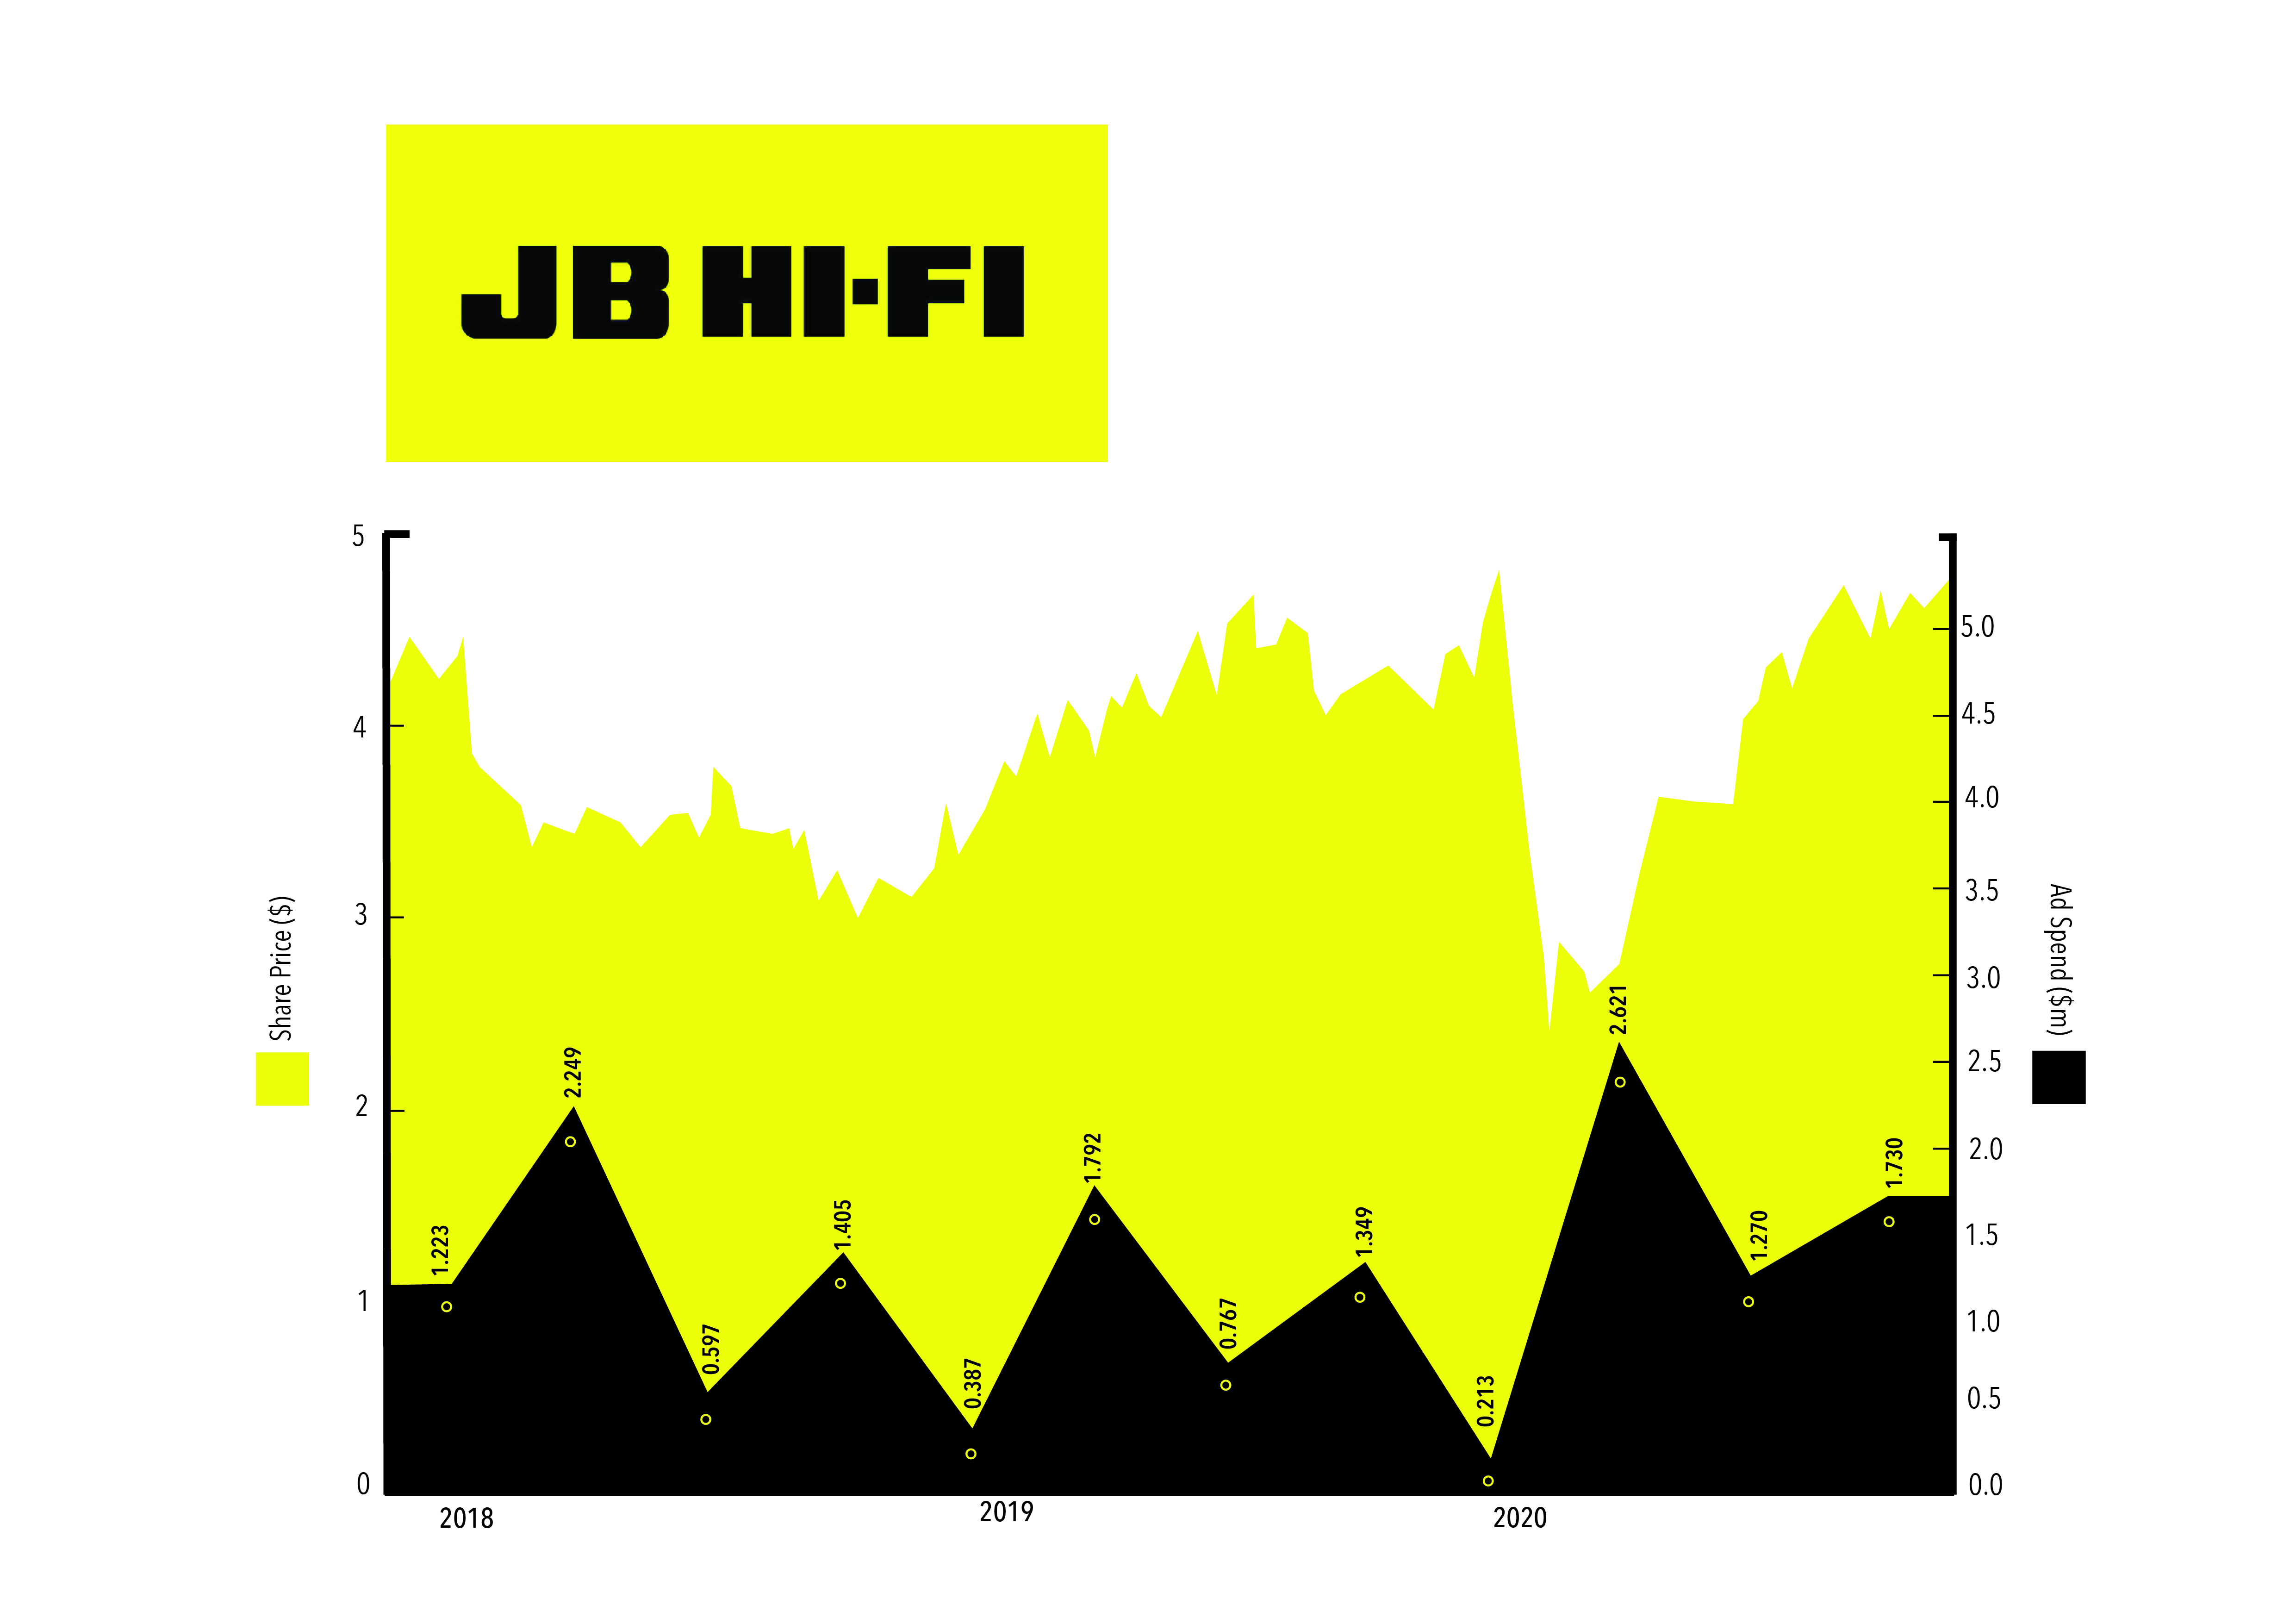
JB Hifi averaged $1.3m per quarter between 2018 and 2020.
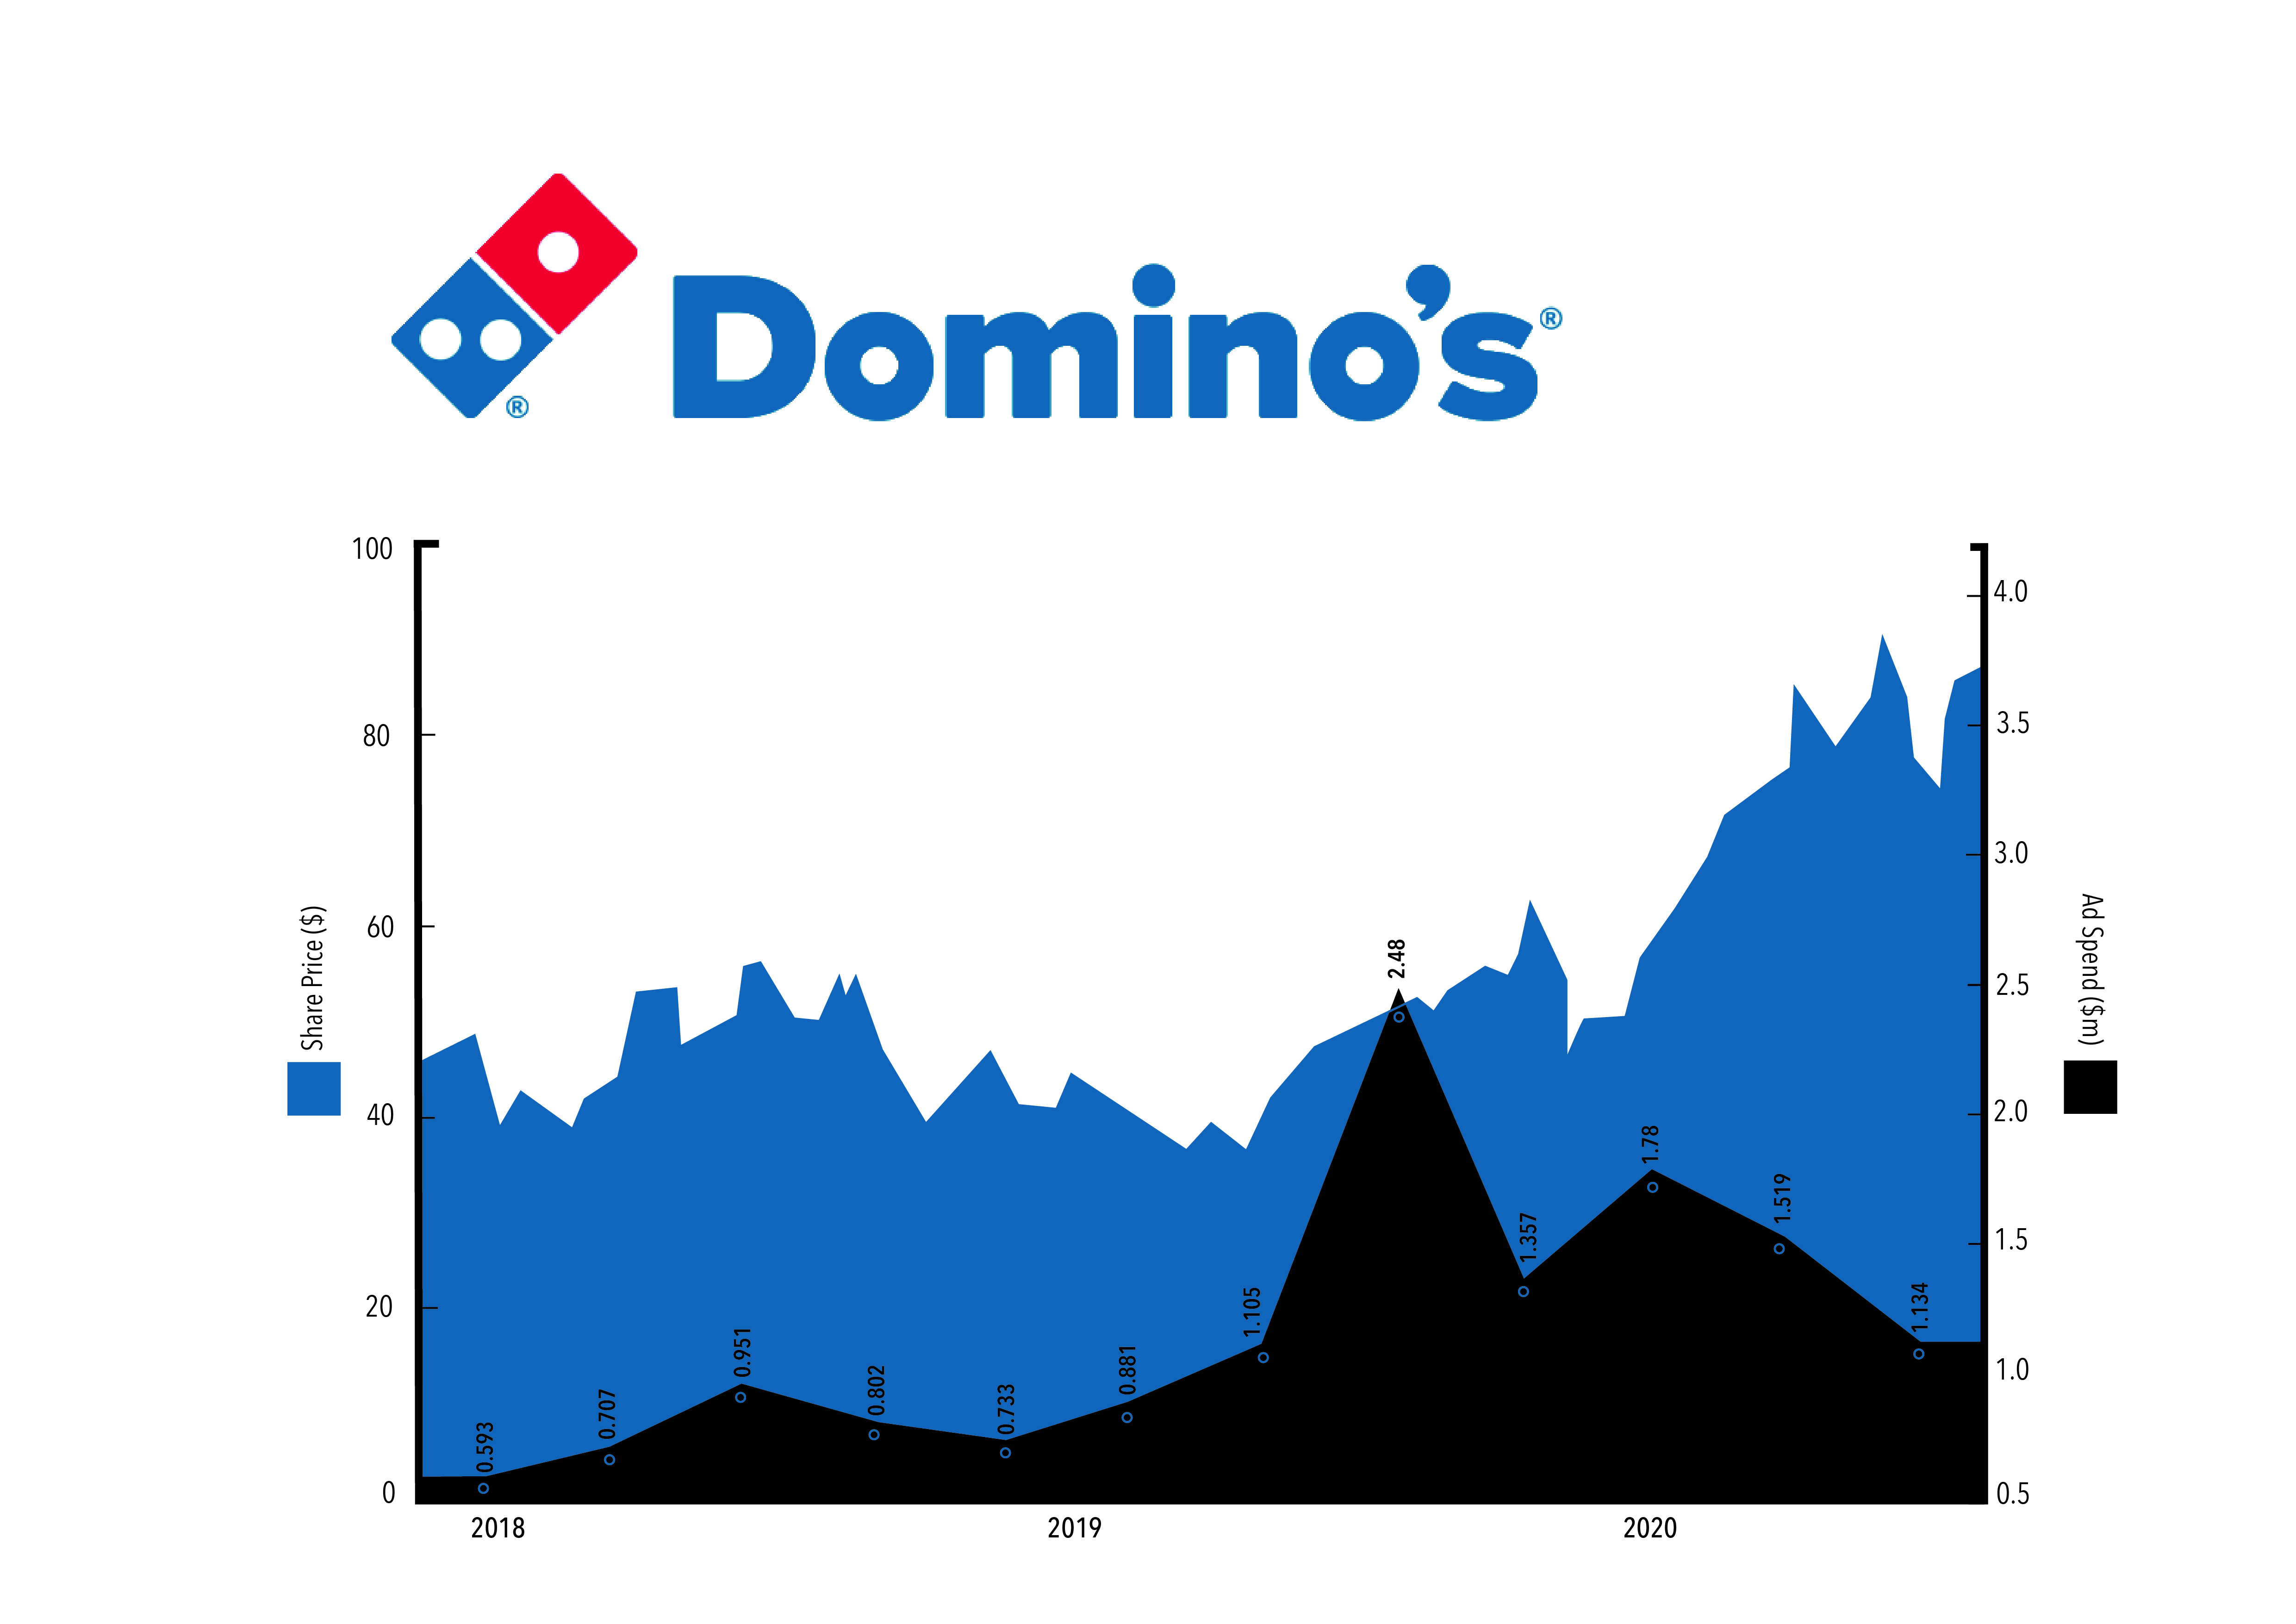
Domino's spent, on average, $1.17m per quarter between 2018 and 2020, with one notable spike in Q4 2019.
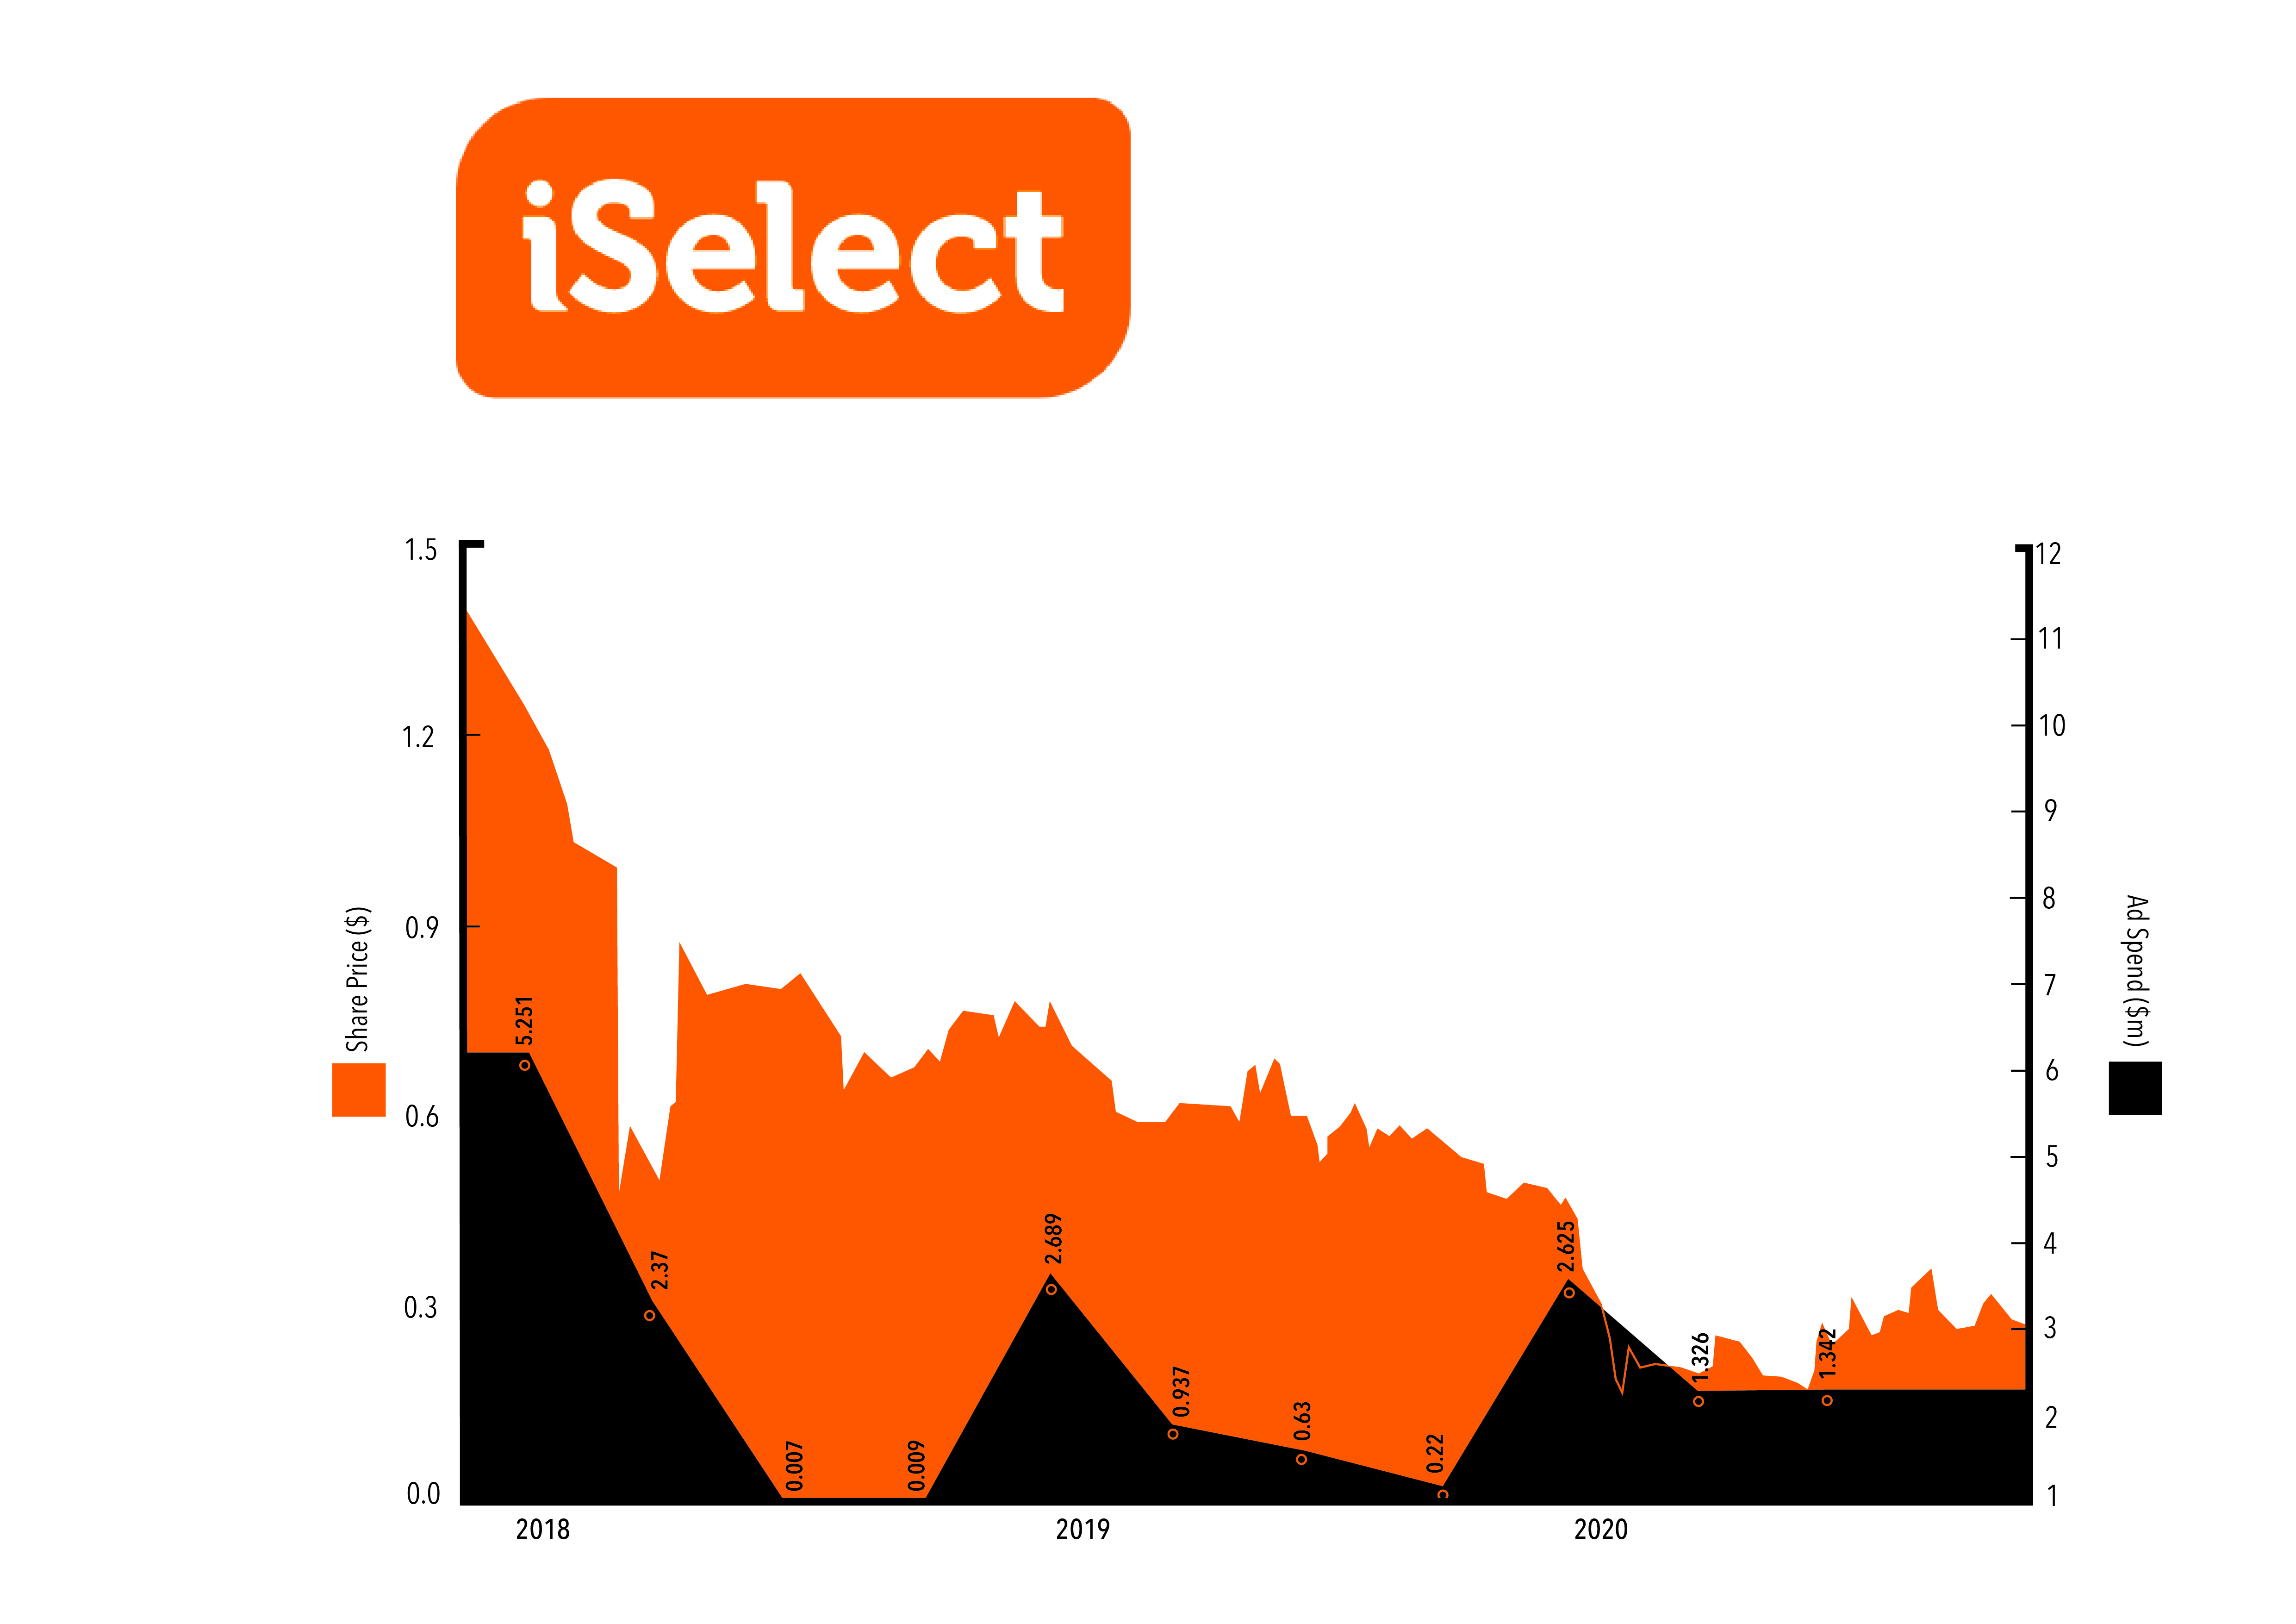
While there was no figure for Q4 2020, iSelect spent $1.58m per quarter on average.