The simple, five-step guide for marketers to demonstrate ESOV, demand brand budget, and arm themselves to battle budget cuts in FY2022/23

Excess Share of Voice (ESOV) is a well-researched formula that outlines the ROI a business can expect from its marketing budget.
There is a clear, evidence-based formula for brands to grow their market share through Excess Share of Voice, or ESOV, Atomic 212°’s James Dixon writes. Here are five simple steps for marketers to use to calculate a budget for growth – and protect against CFO raids.
Excess Share of Voice unpacked
- Excess Share of Voice (ESOV) is a well-researched formula that outlines the ROI a business can expect from its marketing budget
- Presenting a bespoke ESOV is a great way to kick start the FY23 budget conversation with the CFO
- This article walks through the steps needed to calculate and present ESOV
The two years created a surge of economic and consumer spend that saw bumper revenue growth for many of our clients. With the pandemic subsiding, the sales boom is likely to slow, but the happy glow on the face of Chief Financial Officers will linger – and that means it’s a great time to arm yourself for that FY23 budget conversation.
Excess Share of Voice (ESOV) is a well-researched formula that outlines the ROI a business can expect from its marketing budget. It has credence and credibility in academic circles and is a strong foundation for the annual budget negotiation.
Establishing a company's ESOV is relatively straightforward and can be calculated within a week. Let’s look at the steps required:
Step one: Establish the credibility of the ESOV formula
A Nielsen study on ESOV found that, “All things being equal, a brand whose share of voice (SOV) is greater than its share of market (SOM) is more likely to gain market share.”
Great - a credible formula for growth!
Specifically, Nielsen discovered a difference of ten points between SOV and SOM led to extra market share growth of 0.5 per cent.
“Therefore, a brand with a market share of 20.5% with an ESOV of 10 points would grow to 21% market share over a year,” they wrote.
That said, the ESOV formula is best applied as a broad benchmark and not a prescriptive guide to growth.
Still, it is now regarded as a practical, well-evidenced piece of research by the likes of the highly-rated Les Binet and Peter Field, while Mark Ritson described it as “one of the most important and least understood concepts in the world of marketing”.
Of course, nothing is a slam-dunk in our industry, so it’s worth noting that there are detractors. Ben Shepherd has noted that it should be applied with caution.
“It is not a theory that can be generally applied in my view, and it is being frequently being used by many as a way of justifying increased advertising budget, without the requisite diligence behind the request around how these funds would be best deployed,” Shepherd wrote in his book ‘Everything you wanted to know about advertising and media but were too afraid to ask’.
Shepherd isn’t saying ESOV doesn’t work, simply that due diligence and proper understanding are required. Which is what I’m aiming to unpack. Because it is a reasonably easy exercise to complete, and all marketers should research the relationship between SOV and SOM in their category.
Best case: It provides a strong case for more investment. Worst case: It triggers an understanding of competitor market share and marketing spend.
Step 2: Apply the benchmark to your industry
The ESOV formula needs 2 key data points:
1: Share of Market, or SOM
2: Share of Voice, or SOV
Share of Market is typically found through paid research or industry specific intelligence, but Google Trends is a ready and free tool online that will show your business against competitors in terms of brand search volume and is a good, quick place to find a proxy for share of market. Use the tool to see your brand against four competitors over 12 months, export the data, then average out the monthly search share to provide a decent starting point for share of market.
Share of Voice is found by looking at competitor media spends, which is typically something your media agency and their AQX / Nielsen research licences can provide.
To Ben Shepherd’s point above, share of spend does not directly equate to SOV, as it doesn’t include media discount positions and media effectiveness. It is also worth noting the AQX / Nielsen do not have access to Google or Facebook spends, which are coming through as large share of voice budgets of late. If your media agency is a Google or Facebook partner agency, this data is mostly accessible and then can be added into the AQX / Nielsen for a more rounded view.
Step 3: Apply the formula to your business
So now we have total market size and media spend, we can apply the ESOV equation.
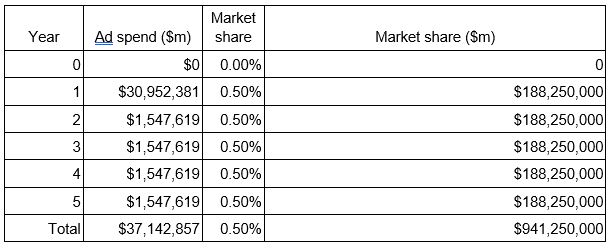
In this example, I will put forward a new car company launching in Australia with 0 per cent market share, but the formula should work for an established business just as well.
In year one, the company will follow ESOV and spend 10 per cent of the total industry media spend – a significant $25 million. The ESOV formula states that will earn them 0.5 per cent market share, a very significant $188m!
This large sales forecast requires a sense check by industry. The formula is reasonably mute on the time required to scale to this result - but it is expected within a 12-month period.
The good news: Reasonable logic – and the ESOV research – suggests this 0.5 per cent market share will continue with a much lower budget equivalent to market share. The excess level was just required to jump start it.
In the table below, you clearly see the return over five years being 30x on the media (assuming an average $50,000 car sale price and an immediate and direct return in market share).
But don’t rush for the CFO just yet - we should apply profit margin to the workings to show true return on investment.
According to Statistica, the auto category averages 5 per cent profit margin.

ESOV has nicely shown a $17 million return, or 20 per cent over five years. This should be a sufficient return for your CFO to see this as a favourable investment against other capital investments, especially if the CEO is demanding growth in profit year on year.
But there are some caveats. As good as the formula is, it simplifies real-life factors such as competitors’ spending more than anticipated or deploying aggressive offers in market across the five-year period.
But it is a worthy exploration based on substantiated research courtesy of its founder, James Peckett, and subsequent review by Binet and Field, Mark Ritson and many other notable marketers.
Step 4: Sense check, competitor check
If you have access to competitor market shares and media spend, the formula can be used to plot these out as well.
It is very interesting to plot competitor data into a ESOV graph and visualise the playing field over time. Below is an example to illustrate my point.
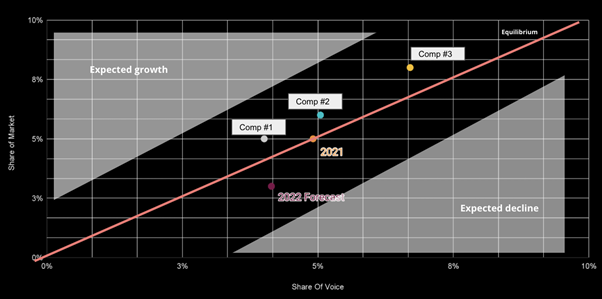
It is very interesting to plot competitor data into a ESOV graph and visualise the playing field over time.
Step 5: Present to CFO
It is quite remarkable – and very useful – that we have a credible formula for growing a business. It is this credibility that gives it weight as a broad benchmark to open a CMO-CFO budget conversation.
Even better is that it is a convenient formula that uses available data and is easily explainable.
ESOV should be taken as a broad guide to growth, but it is a well-researched and evidenced one nonetheless.
I encourage all marketers to run the numbers, plot them out and organise the meeting with your CFO while the post-Covid sales growth is fresh in the books.