Scientific proof that going dark kills brands: All the stats marketers need to defend their budgets

“A man who stops advertising to save money is like a man who stops the clock to save time.”
Extensive research conducted by Byron Sharp and partners at the Ehrenberg Bass Institute finds brands that pull ad spending watch sales dramatically decay. For marketers, it offers all the proof they need to defend ad budgets against cost cutting – in language the CFO will understand.
“A man who stops advertising to save money is like a man who stops the clock to save time.”
That timeless quote is commonly attributed to Henry Ford, sometime early last century. But it encapsulates findings published in June this year in the Journal of Advertising Research on the much debated subject of ‘going dark’.
Going dark – i.e pulling ad spend – raises concerns regarding loss of brand traction and brand equity and the impact to sales that arise. This latest research, both diligent and scientific, provides the following headline figures that marketers can use to defend their budgets:
- Going dark (stopping brand advertising) for a year creates a sales decline of 16 per cent
- Going dark for two years creates a sales decline of 25 per cent
- Going dark for three years creates a sales decline of 36 per cent
There are always caveats - but these headline numbers are worthy benchmarks to establish a broad value of brand activity, providing CMOs with a quantifiable brand investment to sales ratio. Crucially, the numbers are backed by the best academics in the business, the Ehrenberg-Bass Institute with notable support from Adam Gelzinis, a customer insights business partner for Endeavour Group.
So with the credentials outlined, let’s unpick the resarch, fine print and all.
Context and caveats
Firstly the research was conducted against 41 beer and cider brands courtesy of the Ehrenberg-Bass Institute and one of its partner members, the Endeavour Group. The data spans 20 years of sales and marketing and is therefore statistically strong enough to draw empirical conclusions. But note that it applies to fast moving consumer goods where brand advertising and sales correlate tightly and quickly, as opposed to slow moving goods that might show similar trends but over a longer period.
Some 57 cases of ‘no spend’ were identified across the 20 years, and 34 of the cases were ‘no spend’ for more than two years. The decline in sales arising from these cases were used to establish the above benchmarks.
Results: How stopping advertising kills sales
The results are best visualised in the below graph, where the trendline demonstrates the percentage fall in sales after one to 10 years without advertising. The sales index represents the average of all sales across the 41 brands, and the vertical dots represent the number of cases that were below the sales index in each annual period.
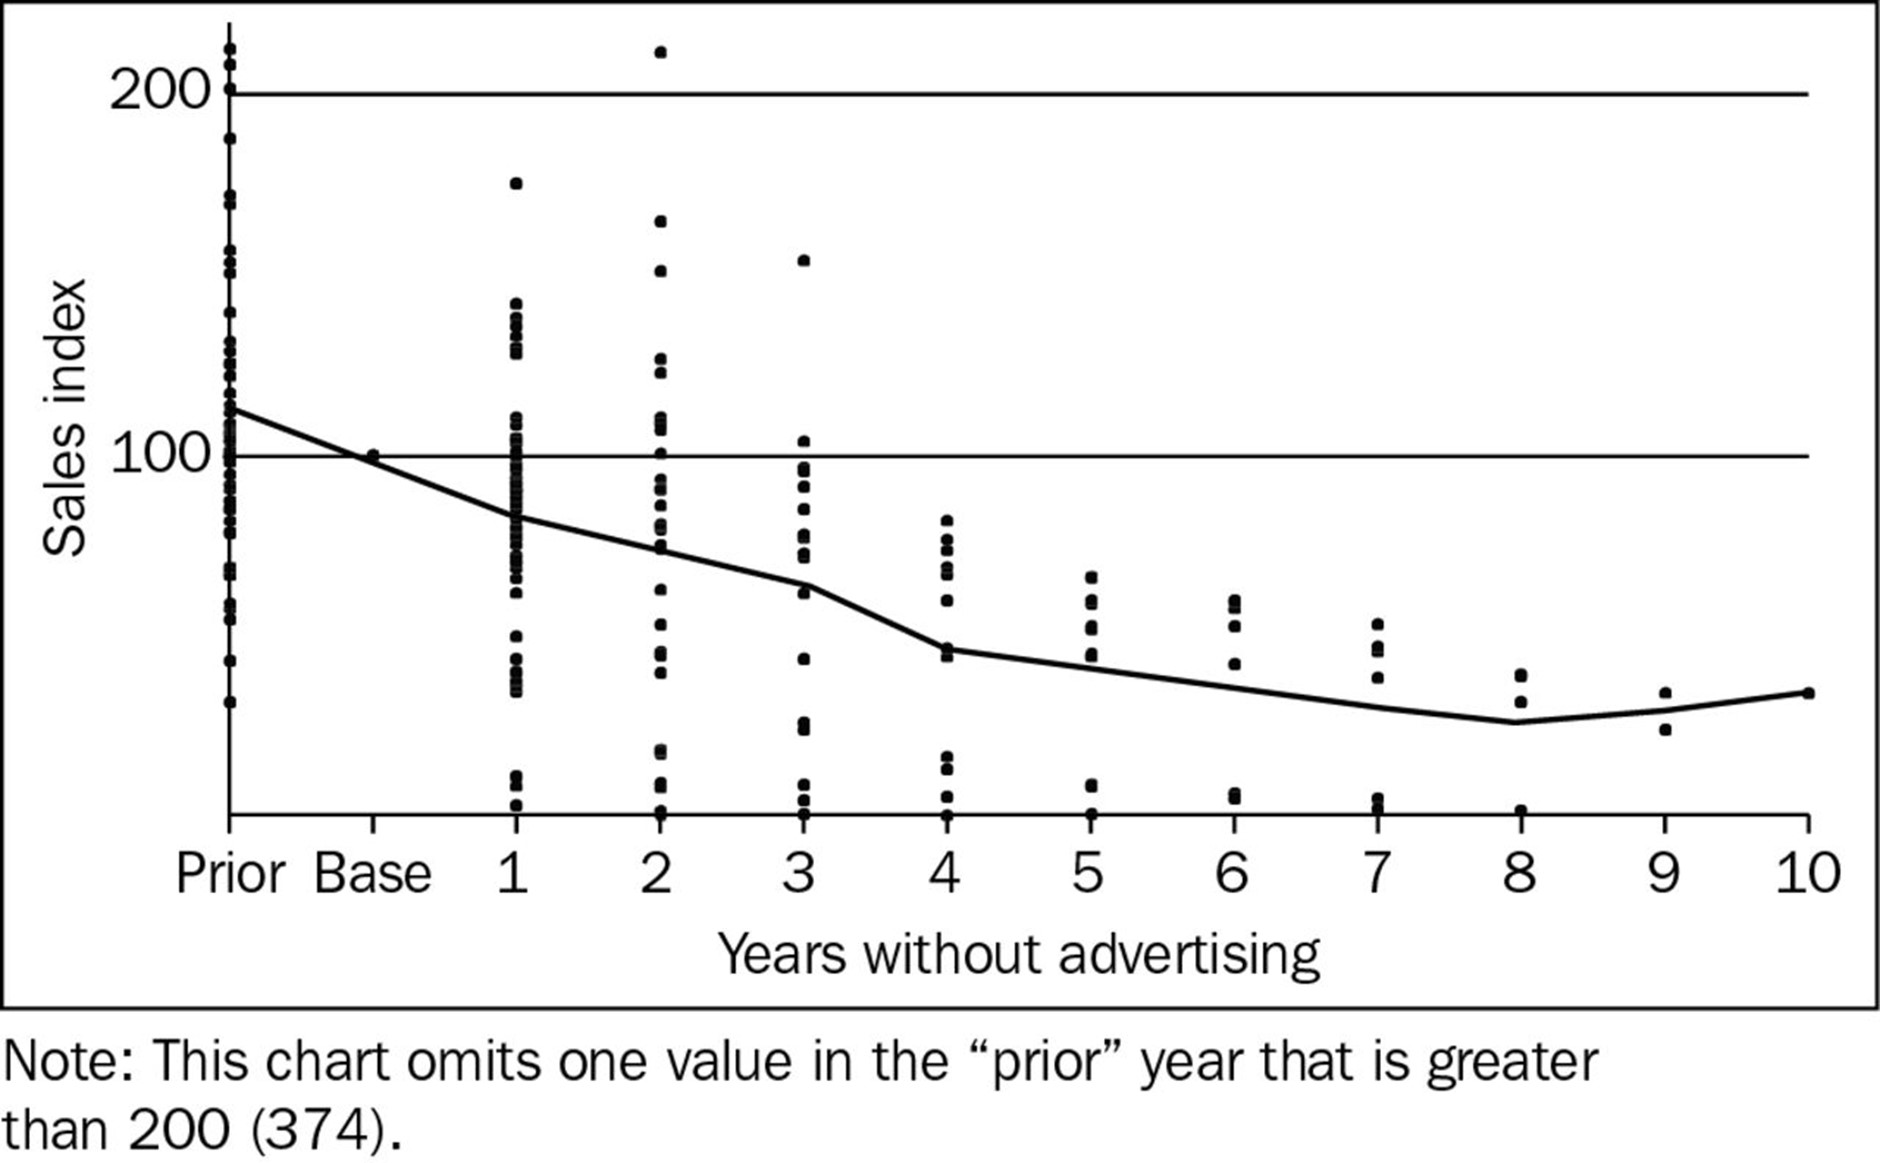
Bookmark this chart! It is a perfect one page guide to going dark. It clearly shows that sales fall in year one and steadily thereafter to a point where there is not much business left in year eight.
The main takeout though is that a business’ current brand budget maintains 16 per cent of its sales. This can be used as a hard defence within the annual budget process.
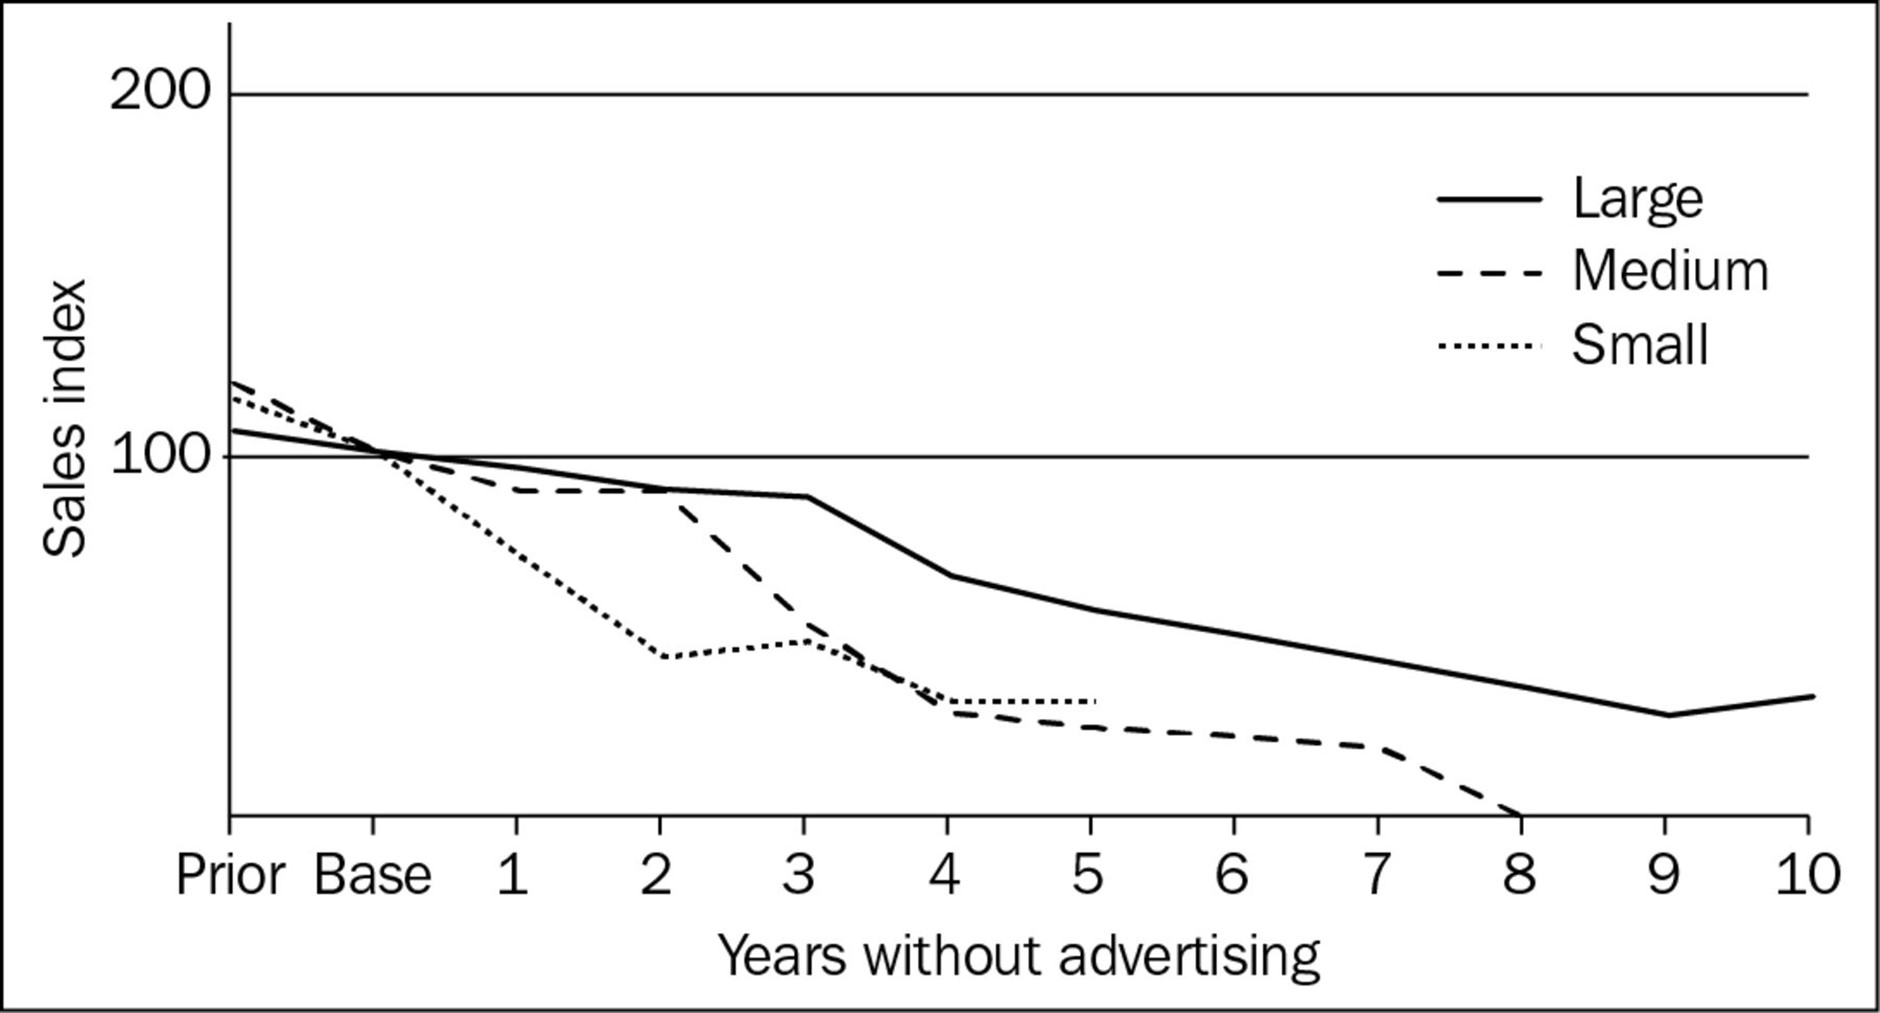
The results vary when categorised by size of brand (large being +1m sales in this category, medium being +250,000 sales). Predictably, the larger brands with higher brand equity took longer to decline, with none reporting extinction within 10 years, as opposed to no small brands surviving five years of no marketing spend. Adjust your budget defence accordingly!
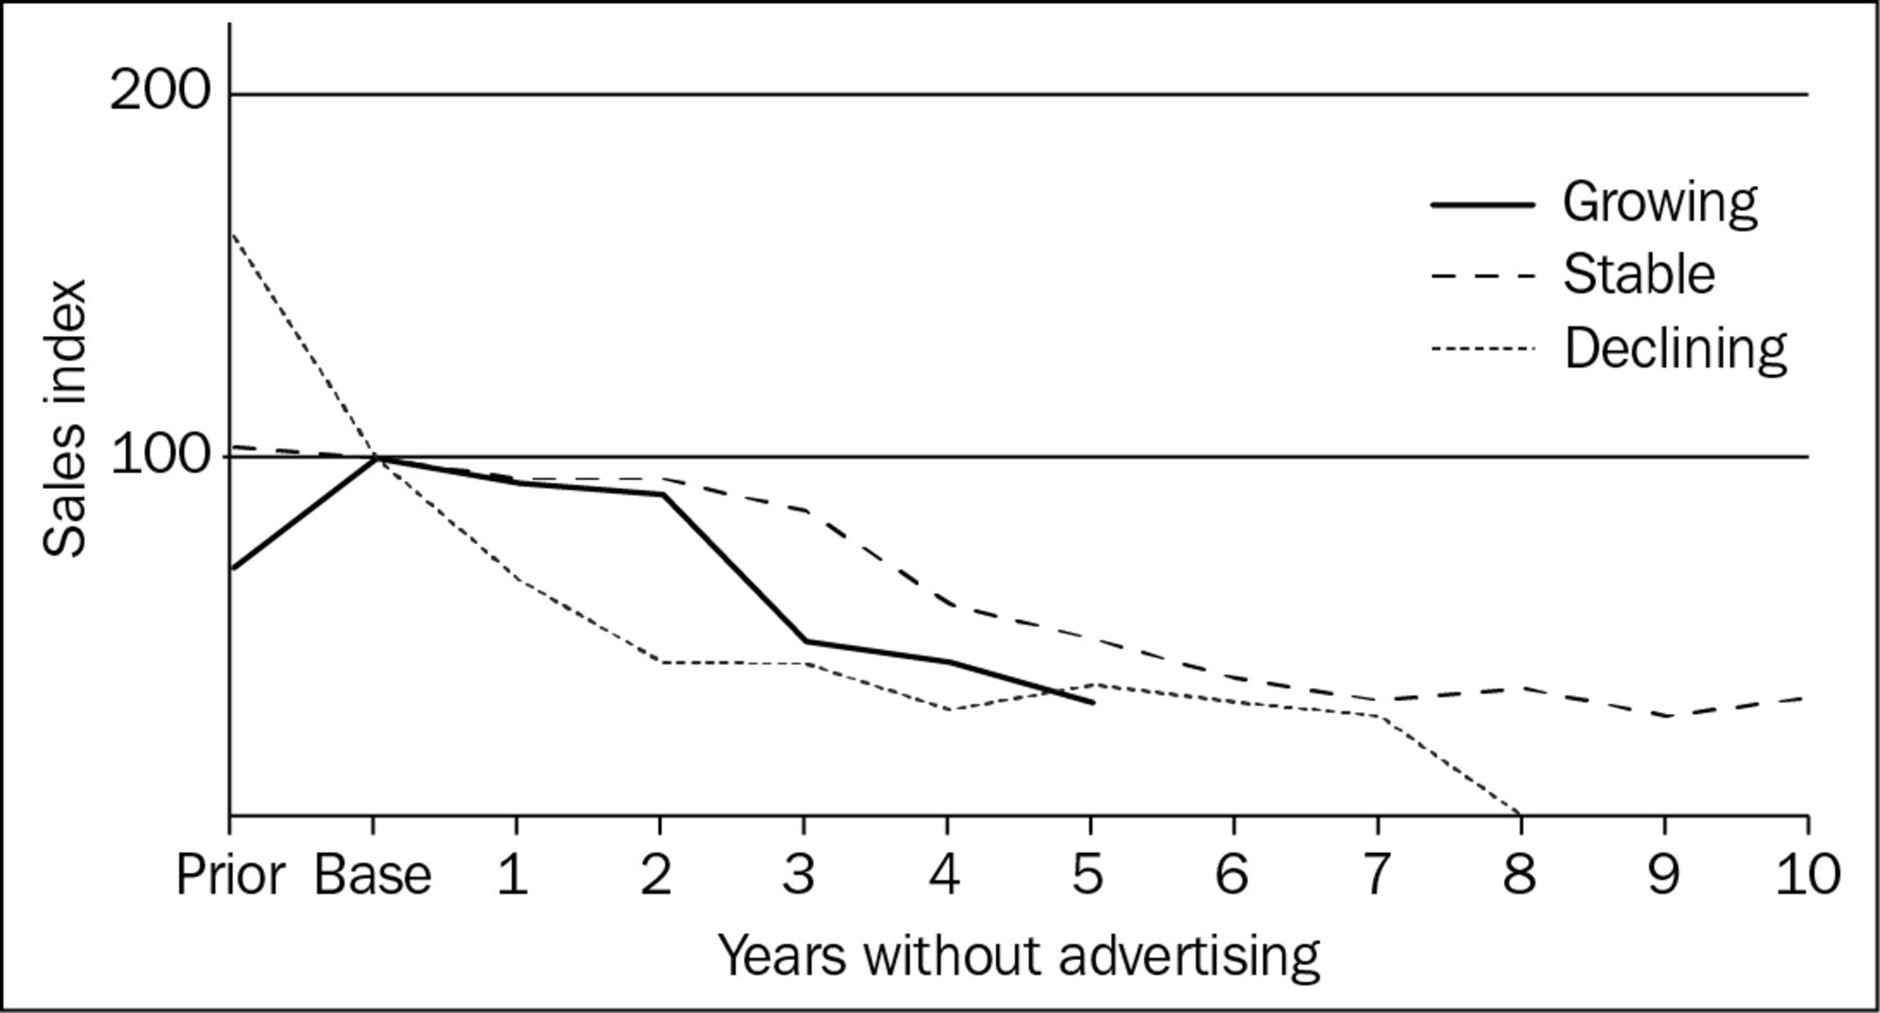
The final really important chart regards brands that were in a sales decline before going dark.
These brands were doomed before going dark and quickly nosedived after. As opposed to brands that were ascending prior to darkness, these maintained brand equity and sales for two years before a significant downward trend in sales.
Interestingly, the regression maths that underpins this research shows that previous sales trajectory (B = .50) more strongly predicts sales changes than brand size (B = .35). The model further suggests that the effect of category growth/decline on changes in brand sales after advertising cessation is relatively minor (B = –.04).
Previous research: Nobody gained sales by pulling ad spend
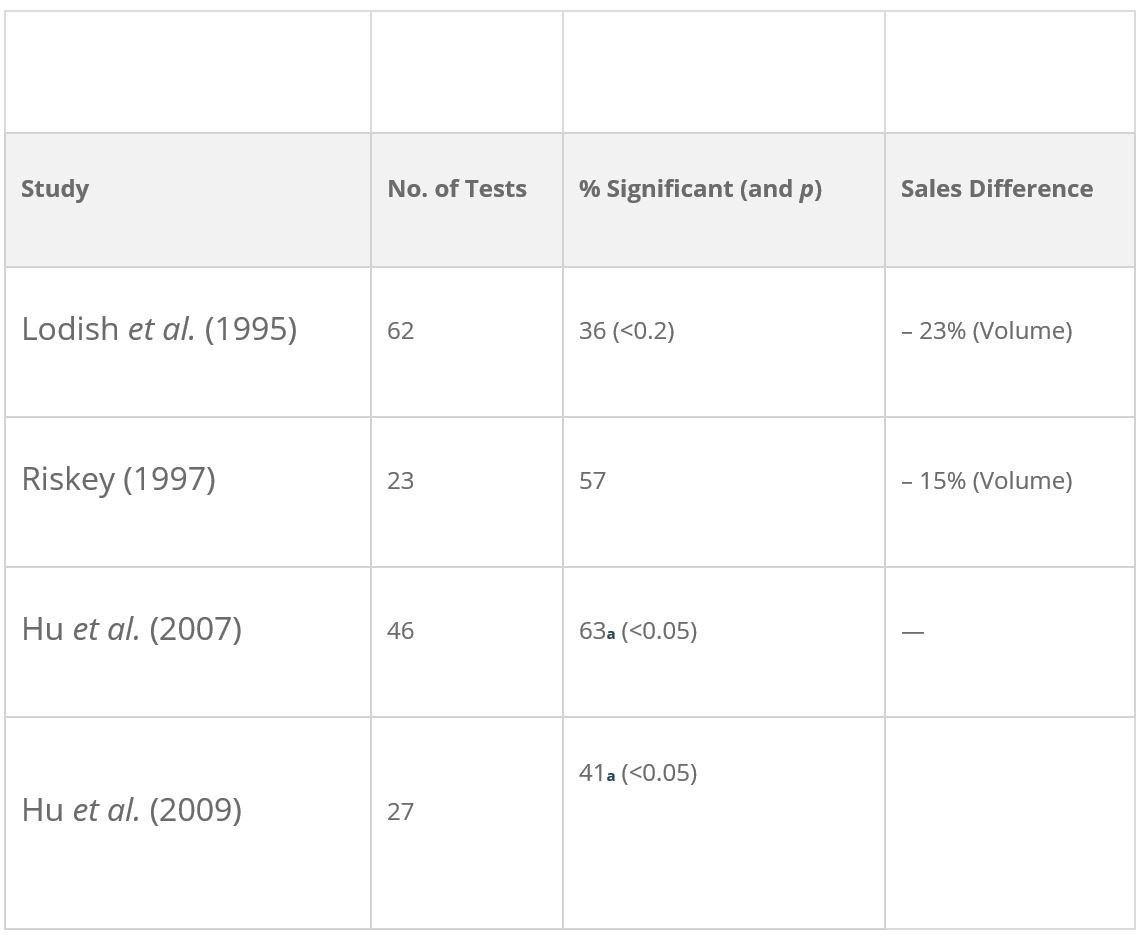
The paper provides an overview of four previous pieces of going dark research across a variety of categories, for a shorter 12 month period. The aggregate results are less conclusive – only 50 per cent of the cases experienced an observable sales reduction within a 12 month period. However it does confirm that no cases experienced an uplift.
Conclusion
As with much marketing research of this nature, there are many factors that contribute to sales growth/decline and the research is diligent in stating its limitations. Pricing, promotions, distribution and competitor activity are excluded from the modelling.
Also the application of the research into other categories is not known because the data relates to one industry. However, the results align with previous similar research in the above table where declines in sales of 15 per cent and 23 per cent were observed within 12 months across an aggregate of many industries.
This research provides a very important benchmark from which marketers can demonstrate the value of brand marketing and investment.
In CFO speak, we now have a clear, well-researched depreciation curve for the brand asset. In round numbers a business can expect a +10 per cent annual decline in sales if the brand and its budget are not maintained.
With credit to:
Nicole Hartnett, Adam Gelzinis, Virginia Beal, Rachel Kennedy, Byron Sharp
Published 23 June 2021